Olaparib and temporary comedication: can an AUC ratio determine dose-restoration timing?
An evidence audit and reversible-inhibition counterexample demonstrate that a scalar coadministration ratio does not identify post-cessation behavior. This is not a reconstruction of published PBPK models, a prediction of patient exposure, or a dose-restoration recommendation.
On this page
- Background and objective
- Existing labeling instructions
- Public PBPK studies and the present question
- Question and intended use
- Three reduced models matching one ratio
- The initial ratio does not identify the subsequent curve
- Multiplying by a dose ratio does not reconstruct a transition
- Dependence on the anchor and diagnostic criterion
- Discussion
- Numerical checks and limitations
- Data and code availability
- References
Background and objective
Literature and labeling checked on October 12, 2026.
Olaparib is a PARP inhibitor whose exposure increases with CYP3A inhibition. Temporary coadministration raises two questions: how far to reduce the dose during inhibition, and when to restore it after stopping the inhibitor.
I examined public PBPK studies for calculations of these transitions. Available materials did not allow reconstruction of the original executable model or independent validation of post-withdrawal behavior. This article instead uses a small example to establish what a single coadministration AUC ratio cannot determine.
The curves are not predictions for patients receiving olaparib. They illustrate identifiability, using a public ratio only as a magnitude anchor. I calculate neither daily AUC nor blood concentrations, efficacy, safety or an optimal restoration time.
Existing labeling instructions
US tablet labeling generally recommends avoiding strong or moderate CYP3A inhibitors. If unavoidable, it specifies 100 mg twice daily with strong inhibitors and 150 mg twice daily with moderate inhibitors, then restoration of the previous dose after three to five elimination half-lives of the inhibitor following discontinuation (1). These are labeling instructions, not recommendations derived here. Decisions in Japan require the applicable current domestic prescribing information.
Using the itraconazole capsule label's repeated-dose parent-drug half-life of 34–42 hours gives the following arithmetic (2).
Table 1. Simple time conversion using the labeled parent-drug half-life.
| Number of parent-drug half-lives | Multiplication by 34–42 hours | Days |
|---|---|---|
| 3 | 102–126 hours | 4.25–5.25 days |
| 5 | 170–210 hours | 7.08–8.75 days |
The relevant half-life is that of the concomitant inhibitor, not olaparib. These are products of a representative range, not an individual's half-life estimate, confirmation that inhibition has resolved, or a calendar instruction applicable to all formulations, treatment durations and patients.
Public PBPK studies and the present question
A 2019 Simcyp study examined formulation differences, CYP3A inhibition and induction, among other questions (3). Its Table 2 reports an observed AUC ratio of 2.70, an observed Cmax ratio of 1.42 and a PBPK-predicted AUC ratio of 3.55 when a single 100 mg olaparib tablet dose was given 96 hours after itraconazole initiation. Observations and model predictions occupy different columns.
This is not an observed steady-state ratio during 300 mg twice-daily dosing. The single-dose ratio cannot be transferred directly to any day of repeated dosing or to withdrawal. The original model also represents olaparib's reversible inhibition, time-dependent inhibition and induction.
A separate PK-Sim study appeared in 2023 (4), and a 2026 PBPK study addresses formulation bridging (5). A newer publication does not automatically validate inhibitor-withdrawal predictions.
Table 2. Available information and limitations for the present question.
| Material examined | Available information | Missing for this question |
|---|---|---|
| 2019 PBPK study | Input tables, known DDI conditions and results, supplementary material | Complete original executable model and independent post-withdrawal observations |
| 2023 PK-Sim study | Parameters in the text and supplementary PDF | No executable project found at the examined publication location |
| 2026 formulation study | Validation for another use involving formulation differences and variability | Not validation of inhibitor withdrawal |
| Product labels | Approved coadministration and dose-restoration instructions | Individual post-withdrawal profiles or comparisons of alternative restoration conditions |
Insufficient public detail does not justify relabeling a simple clearance correction as PBPK. I did not proceed to selecting restoration conditions with a purported reconstruction of the original PBPK model. The reduced model below answers a narrower question.
Question and intended use
The question is whether the same coadministration AUC ratio can coexist with different post-withdrawal inhibition curves, and what further information hypothetical restoration comparisons require.
The intended use is research interpretation of public DDI information and the requirements for validating a post-withdrawal model. It excludes patient dose changes, clinical-trial dose selection and recommending alternatives to labeling instructions. This is neither a patient-data reanalysis nor a newly estimated or validated PBPK model.
Three reduced models matching one ratio
Start with reversible inhibition alone. Normalize uninhibited elimination capacity to 1; let fraction \(f\) be reduced by inhibition while fraction \(1-f\) remains unchanged. With \(x=I_u/K_i\), the ratio of unbound inhibitor concentration at the inhibition site to its inhibition constant:
\[ g=1-f+\frac{f}{1+x},\qquad R=\frac{1}{g} \]
Under fixed absorption, linear elimination and constant inhibition, \(R\) corresponds to an equal-dose AUC ratio. If inhibition changes over time, however, \(R(n)\) is the ratio obtained by freezing conditions at that instant, not actual interval AUC.
Assume exponential decline after withdrawal:
\[ n=\frac{t}{H},\qquad x(n)=x_0 2^{-n} \]
Here \(H\) is an assumed half-life of the inhibition-site concentration in this example. It is not identified with itraconazole's parent-drug terminal half-life or an enzyme-recovery half-life. The horizontal axis \(n\) is therefore not converted to patient days.
Use the observed 2.70 only as the initial magnitude anchor \(R_0\). For each chosen \(f\), set:
\[ s=1-\frac{1}{R_0},\qquad x_0=\frac{s}{f-s} \]
Each then satisfies \(R(0)=2.70\). This requires \(f>s\); inadmissible combinations cannot be constructed.
The selected \(f=0.75,0.85,0.95\) values are illustrative, not estimates of olaparib's CYP3A contribution. Nor is \(x_0\) obtained from measured concentrations or Ki. Matching the anchor is algebraic calibration, not model validation.
The initial ratio does not identify the subsequent curve
Table 3. Reduced examples calibrated to the same initial ratio.
| Assumed f | Calibrated x₀ | R(0) | R(3) | R(5) | n until R=1.10 |
|---|---|---|---|---|---|
| 0.75 | 5.231 | 2.70 | 1.421 | 1.118 | 5.25 |
| 0.85 | 2.857 | 2.70 | 1.288 | 1.075 | 4.58 |
| 0.95 | 1.965 | 2.70 | 1.231 | 1.058 | 4.22 |
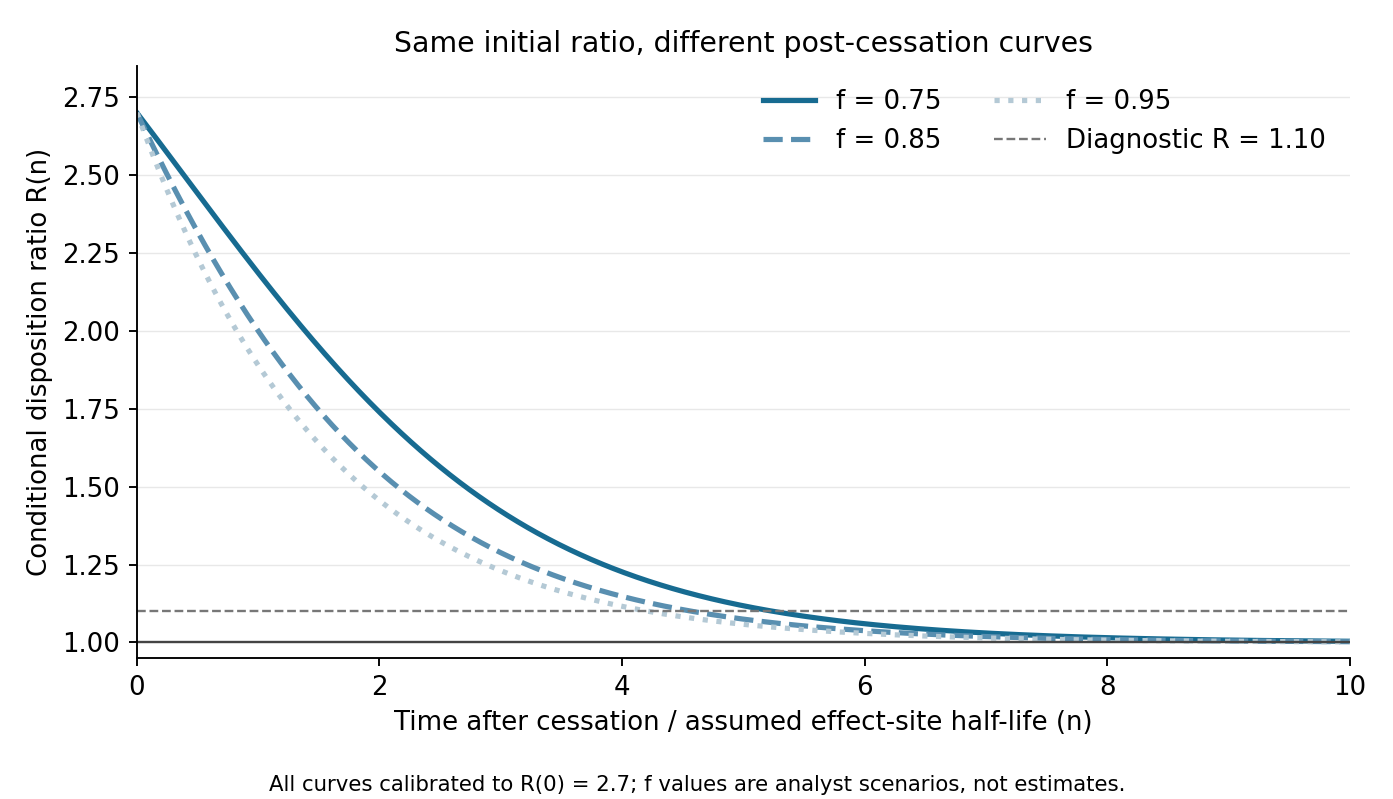
Figure 1. The horizontal axis counts assumed half-lives; the vertical axis is R with conditions frozen at each time. Initial ratios and assumed x decay rates match, but the decomposition of elimination capacity differs. The dashed R=1.10 line is an arithmetic proximity criterion, not a safety boundary. Figures and tables are generated by analysis/run_analysis.py.
This does not identify which fraction is correct. It is a counterexample showing that one ratio cannot separately identify \(f\) and \(x_0\).
Even \(H\) is held common here. Real transitions involve inhibitor concentrations, metabolites, liver and intestine, and olaparib accumulation. If the smaller problem is already nonunique, a single coadministration ratio cannot uniquely determine the clinical transition.
Multiplying by a dose ratio does not reconstruct a transition
Normalize a reduced dose as 100/300 and the original dose as 300/300, switching hypothetically at \(n=0,3,5\):
\[ B(n)=\frac{D(n)}{300}\,R(n) \]
This is an algebraic dose-ratio times conditional-ratio index, not blood concentration or daily AUC. Dose proportionality can justify multiplication under fixed, linear steady-state conditions. Representing drug remaining in the body immediately after withdrawal requires integrating absorption, distribution and elimination over time.
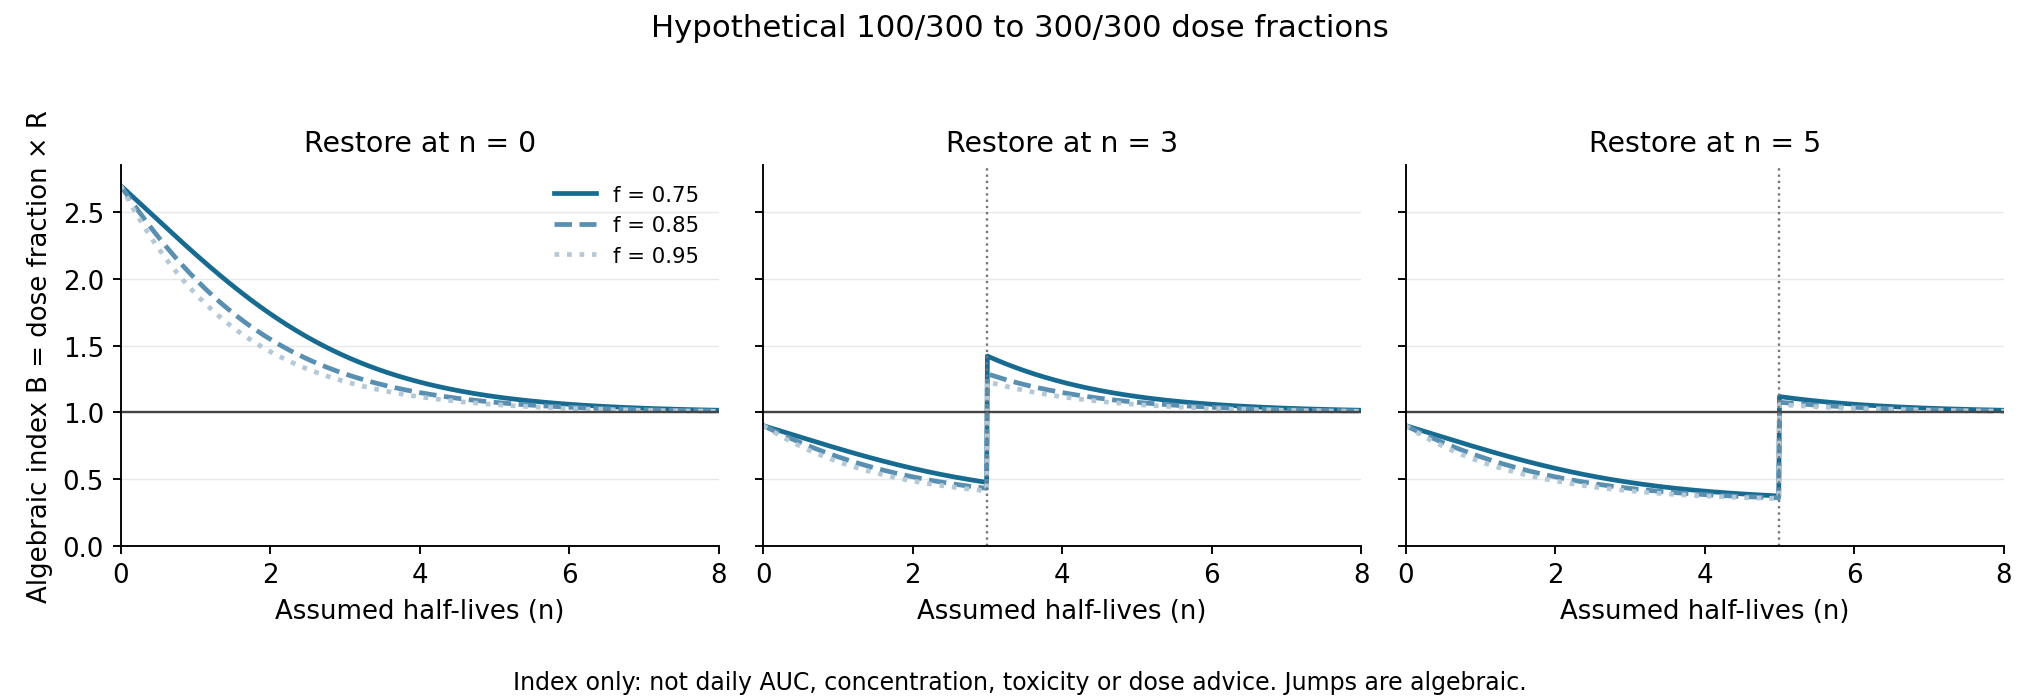
Figure 2. Mathematical switches at zero, three or five assumed half-lives. B=1 normalizes monotherapy at the original dose; it is not a therapeutic range. Jumps reflect substituting a dose multiplier, not a prediction that concentration changes instantaneously.
The initial product 100/300×2.70 is 0.90. That does not establish appropriate exposure: 2.70 anchors a single-dose observation, and transfer to these hypothetical conditions has not been clinically validated. Curve height cannot be interpreted as excessive or inadequate exposure, toxicity or efficacy.
Choosing early versus late restoration requires actual post-withdrawal exposure and its clinical meaning. This figure selects neither.
Dependence on the anchor and diagnostic criterion
Time to reach R=1.10 depends on both the initial ratio and \(f\).
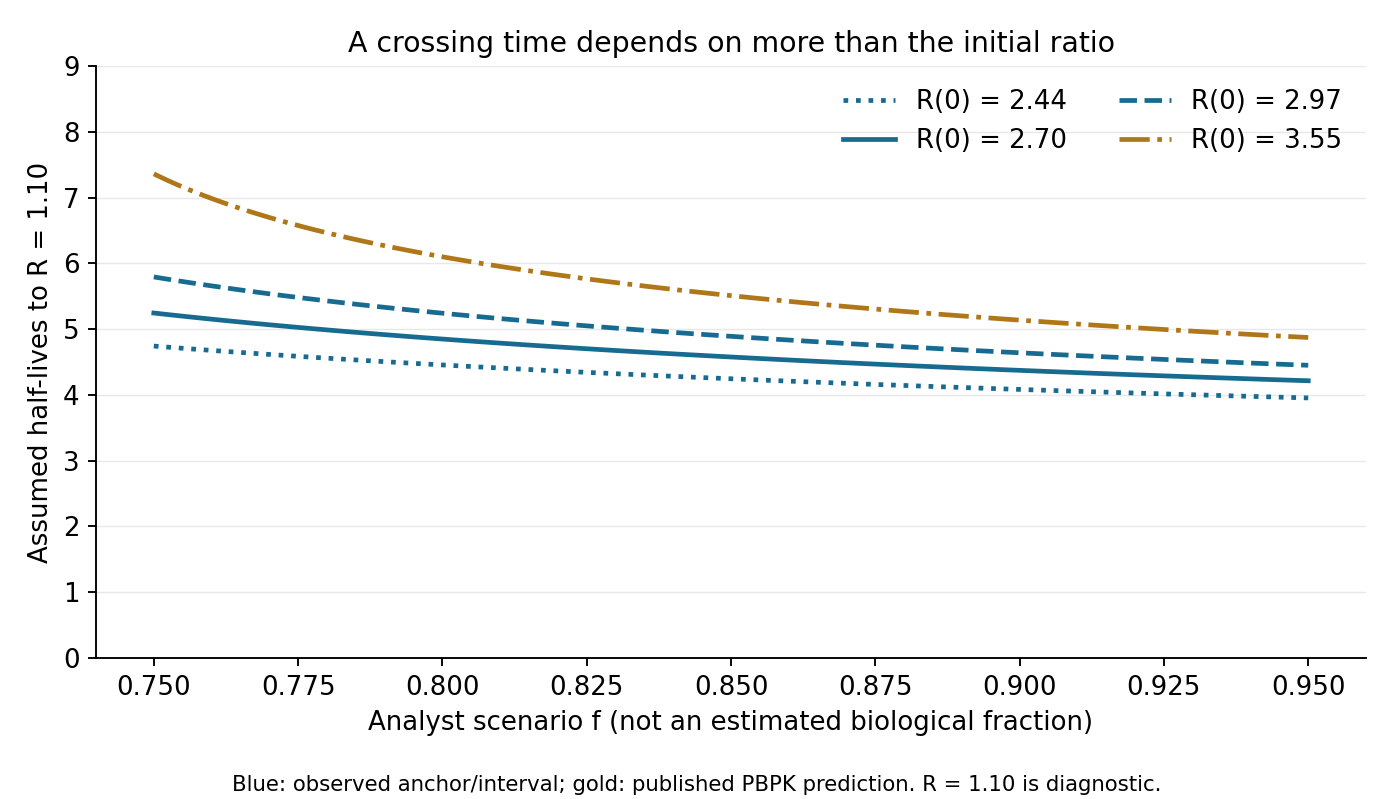
Figure 3. Blue examples use the observed 2.70 and its reported geometric-mean AUC-ratio 95% interval of 2.44–2.97 in the original Table 2 as separate magnitude anchors. Gold uses the table's PBPK prediction of 3.55. The set of curves is neither a confidence interval nor a patient distribution. R=1.10 is not a clinical restoration criterion.
Repeating the calculation with diagnostic criteria R=1.05, 1.10 and 1.25 produced 252 conditions saved as CSV. Their range reflects selected assumptions, not a probability distribution of true recovery time. I neither average the observed 2.70 with the predicted 3.55 nor interpret their difference as a post-withdrawal prediction error.
A number of half-lives emerges only after specifying both mechanism and criterion. This does not revalidate labeling instructions using Figure 3's diagnostic lines.
Discussion
Matching the initial ratio and decay time did not make subsequent conditional ratios equal. Calibration to an anchor differs from predicting a transition.
Mechanistic itraconazole PBPK work distinguishes parent drug and hydroxy metabolites (6); the single \(x\) here does not. It also omits enzyme synthesis and degradation and olaparib accumulation. It is not a full account of inhibition recovery from parent-drug decline.
The examples at three and five half-lives illustrate nonuniqueness. They support neither changing label instructions nor scheduling clinical blood sampling.
Numerical checks and limitations
The work comprises a public PBPK and label audit and calculations of several models matching one coadministration ratio. Exponential decay was checked against an independent ODE solution and diagnostic crossing points against independent numerical root finding. Six tests passed, covering the anchor, limits, monotonicity, input constraints and dose switches. Numerical verification does not replace clinical validation.
A coadministration ratio and a return time after withdrawal are not determined by the same information. This result does not modify labeling. The reduced example lacks post-withdrawal time series for inhibitor, metabolites and olaparib; comparing actual restoration conditions requires a model representing those dynamics and independent observations for validation.
Data and code availability
Equations, figures, CSV files and code are original to this example. The distribution contains no original-paper figures, supplementary files or patient data.
Download code, numerical tables and rerun instructions.
References
- AstraZeneca Pharmaceuticals LP. LYNPARZA (olaparib) tablets: US prescribing information. Revised 2025 Jul. Section 2.4. DailyMed.
- Janssen Pharmaceuticals Inc. SPORANOX (itraconazole) capsules: US prescribing information. Updated 2026 Jul 13. Pharmacokinetics and Metabolism. DailyMed, version 31.
- Pilla Reddy V, Bui K, Scarfe G, Zhou D, Learoyd M. Physiologically Based Pharmacokinetic Modeling for Olaparib Dosing Recommendations: Bridging Formulations, Drug Interactions, and Patient Populations. Clinical Pharmacology & Therapeutics. 2019;105(1):229–241. doi:10.1002/cpt.1103.
- Gao D, Wang G, Wu H, Ren J. Physiologically-based pharmacokinetic modeling for optimal dosage prediction of olaparib when co-administered with CYP3A4 modulators and in patients with hepatic/renal impairment. Scientific Reports. 2023;13(1):16027. doi:10.1038/s41598-023-43258-9.
- Dong J, Moir A, Pepin X, Lowe E, Hopkins S, Tang W, et al. Is a Clinical Trial With a Non‐Bioequivalent Batch Necessary? The Critical Role of Intrasubject Variability in Olaparib Formulation Bridging by PBPK. Clinical Pharmacology & Therapeutics. 2026;120(1):203–213. doi:10.1002/cpt.70284.
- Chen Y, Cabalu TD, Callegari E, Einolf H, Liu L, Parrott N, et al. Recommendations for the Design of Clinical Drug–Drug Interaction Studies With Itraconazole Using a Mechanistic Physiologically‐Based Pharmacokinetic Model. CPT: Pharmacometrics & Systems Pharmacology. 2019;8(9):685–695. doi:10.1002/psp4.12449.