Menin inhibitors with azoles: what can be borrowed from public PK and DDI evidence?
On this page
Abstract
Public labels, FDA assessments and a ziftomenib PBPK paper were examined to assess transfer of azole interaction ratios between menin inhibitors. Label summaries, calibration ratios and conditional predictions supplied different evidence. Across seven published metabolism-fraction scenarios, none jointly met the selected 0.80–1.25 AUC and Cmax screening range, although wider tolerances changed that result. Borrowing a twofold ratio produced endpoint-dependent discrepancies. A reduced model also showed that AUC alone cannot distinguish absorption changes, residual enzyme activity and metabolic contribution. These sources do not justify a class-wide multiplier or independently validate clinical predictions.
Introduction
Revumenib and ziftomenib both undergo CYP3A metabolism. Can an azole interaction multiplier from either guide development of another menin inhibitor?
The labels already require distinctions. Revumenib describes approximately twofold increases in AUC and Cmax with strong azole inhibitors. Ziftomenib instead predicts increases of up to threefold for AUC and up to twofold for Cmax. Clinical-study label summaries and predicted upper values are different types of evidence (1, 2).
The public evidence examined here does not justify a common azole multiplier across menin inhibitors. Differences extend beyond the numbers: PK tables contain model-derived quantities, and a paper's description of validation differs from FDA's assessment for a particular use. Independent validation and agreement across AUC and Cmax require separate examination.
Scope and verification methods
The quantity of interest is where transferring existing azole information to another drug loses consistency with that drug's public evidence. The context is public-data research on compatibility and information gaps, not patient dose changes or clinical-trial dose selection.
This is an information audit and reduced-model analysis of aggregate PK/PBPK results, rather than NLME estimation from individual concentrations or a full Simcyp PBPK reimplementation. Missing patient characteristics were not replaced with virtual individuals and presented as observed-data validation.
Source comparisons and calculations
Different evidence types within PK tables
Labels, both FDA reviews and the 2026 ziftomenib PBPK paper were examined. Input CSVs retain source version, dose conditions, first-dose versus steady-state timing, and observed versus model-derived provenance.
Table 1. Evidence types and comparison limits
| Information | Type of quantity | Comparison limitation |
|---|---|---|
| Revumenib, approximately twofold with azoles | Label Clinical Studies summary | Not a universal constant for every azole and condition |
| Revumenib label PK table | Aggregate 160 mg BID with inhibitor and 270 mg BID without | Doses and patient groups differ |
| Ziftomenib label PK table | PopPK-derived summaries at 600 mg QD, C2D1 | Not independent observational validation |
| FDA ziftomenib Table 66 | Predictions under conservative fm assumptions | Not a patient-validated true value |
| Original Tables 2 and 3 (3) | Sensitivity to calibration-group ratios and conditional PBPK predictions | Separate first dose from Day 29 and calibration from prediction |
For example, the raw AUC ratio between revumenib label rows is 1.74 and the dose-normalized ratio is 2.94. The corresponding ziftomenib label-row ratio is 2.39. These calculations are not within-patient DDI contrasts changing only azole exposure under the same dose. Dose normalization does not remove differences in patient backgrounds or dosing histories (REVUFORJ Table 9, 1; FDA ziftomenib review, printed p. 133, 4).
Agreement on AUC does not establish agreement on Cmax
The published ziftomenib PBPK sensitivity analysis varies CYP3A metabolic contribution \(f_m\) from 20% to 80% in seven conditions. Simulated results divided by the clinical group ratios used for calibration give S/O. Here 0.80–1.25 was selected as a consistency screen, not a clinical acceptance range or approval criterion.
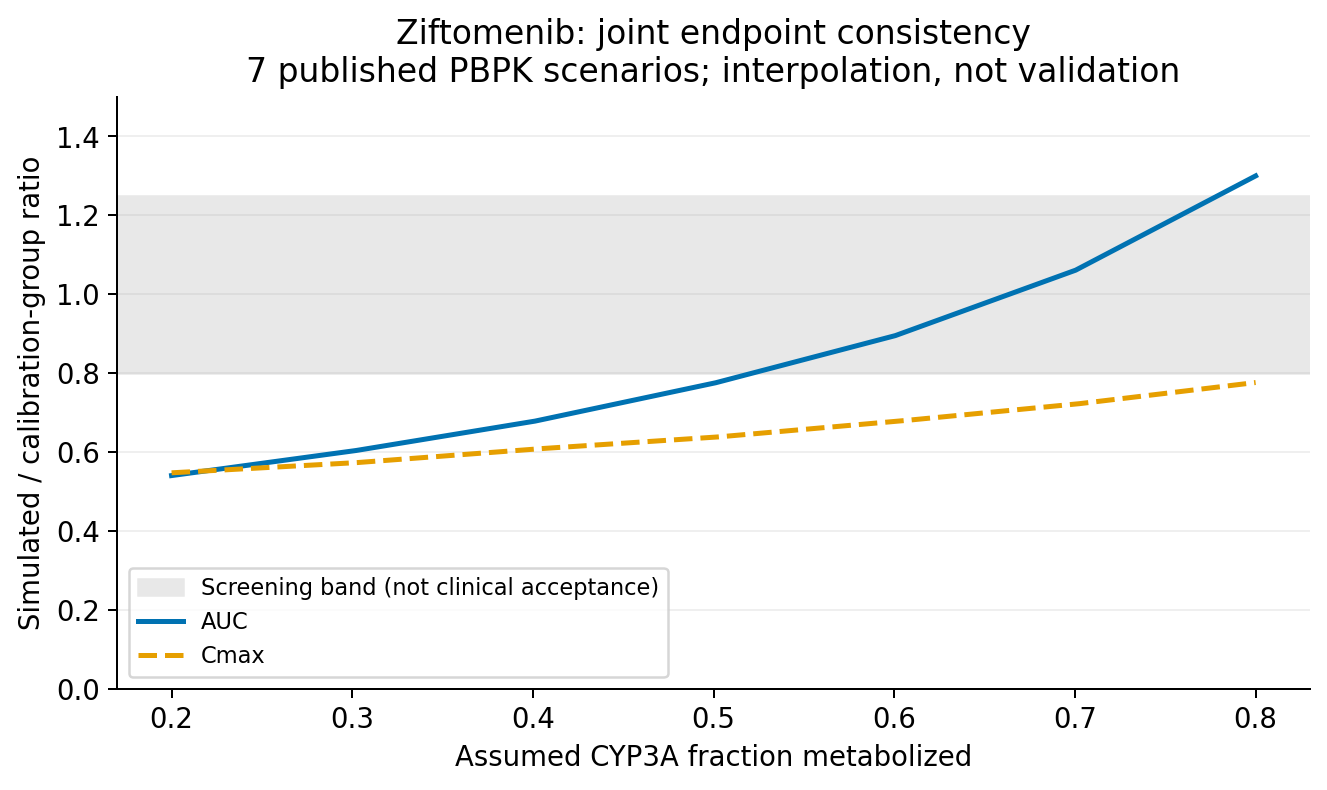
Figure 1. Published sensitivity conditions with linear interpolation. Gray marks this analysis's screening range. Agreement concerns ratios used in calibration, not independent validation.
Some \(f_m\) values met the AUC range. Cmax S/O reached only 0.776, so none of the examined conditions met both criteria. This does not establish impossibility for all \(f_m\) values or other model structures. Moving this one parameter to match AUC did not explain the early peak (original Table 2, 3).
Back-calculating reference ratios from S/O and simulated interaction ratios gives approximately 2.25–2.27 for AUC and 2.00–2.02 for Cmax. These ranges reflect printed rounding, not clinical confidence intervals or reconstructed individual observations.
A sensitivity calculation added after the initial analysis widened the tolerance:
Table 2. Joint endpoint screening under different tolerances
| Simulated/reference tolerance | Published conditions passing both AUC and Cmax |
|---|---|
| 0.80–1.25 | 0/7 |
| 1/1.5–1.5 | 3/7 |
| 0.50–2.00 | 7/7 |
The paper also discusses twofold error in model-performance evaluation. No passes under the stricter criterion do not prove inadequacy for every purpose. Passing a wider range does not validate extrapolation to other inhibitors or drugs. Required accuracy and independent verification data depend on the intended use.
Borrowing twofold creates different endpoint discrepancies
A twofold multiplier from revumenib's azole summary was transferred to ziftomenib with itraconazole. FDA Table 66 was the main reference and original Table 3 the sensitivity reference (3, 4). The table uses FDA's conservative \(f_m=0.7\) condition.
Table 3. Borrowed multiplier versus a conditional ziftomenib benchmark
| Endpoint | Borrowed value | Conditional ziftomenib benchmark | Discrepancy |
|---|---|---|---|
| AUC ratio | 2.0 | 2.6 | −23.1% |
| Cmax ratio | 2.0 | 1.7 | +17.6% |
The calculation is \(100(R_{borrowed}/R_{benchmark}-1)\). It concerns predicted ziftomenib 600 mg QD with itraconazole 200 mg QD, not patient prediction errors (FDA Table 66, printed p. 312, 4).
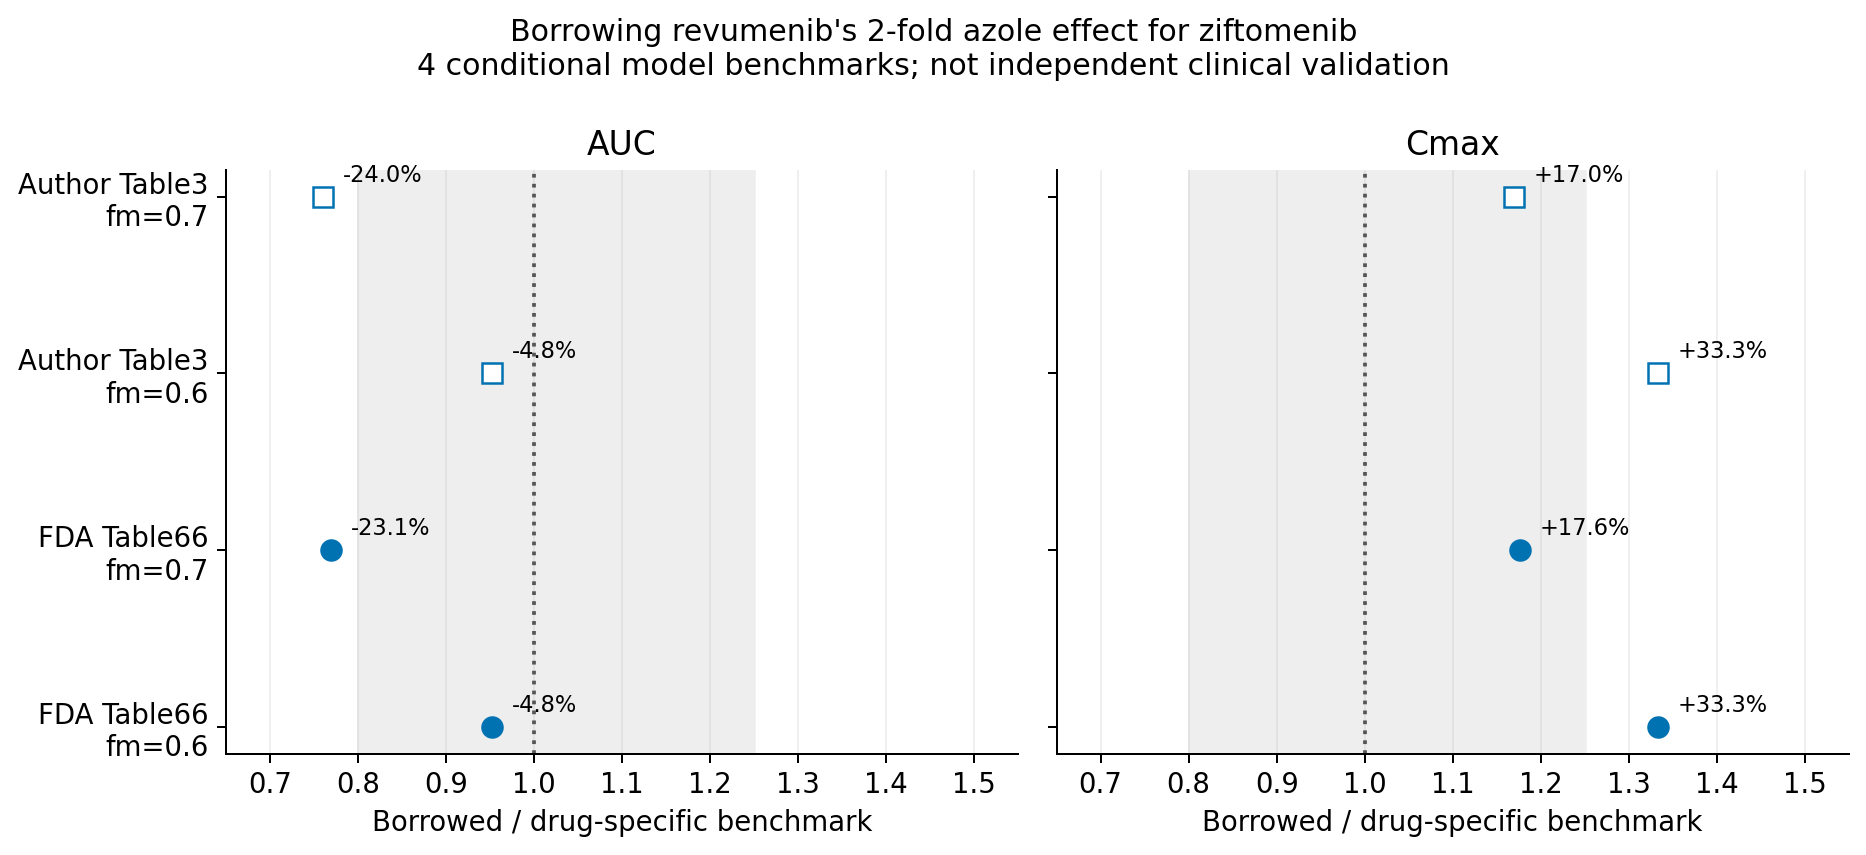
Figure 2. Separate conditional benchmarks. Filled points use FDA results and open points the paper at \(f_m=0.6/0.7\). Gray marks the selected screening range, not cross-drug equivalence.
At \(f_m=0.6\), AUC discrepancy shrank while Cmax discrepancy grew. A single multiplier cannot uniformly be called conservative: it may underestimate AUC and overestimate Cmax. Safety or efficacy ranking would additionally require drug-specific E–R evidence.
AUC alone does not separate metabolism from absorption
The reduced equation was
\[ R_{AUC}=\frac{B}{1-f_m+f_mr} \]
\(B\) is the oral-bioavailability ratio, \(r\) residual CYP3A activity and \(f_m\) the inhibited pathway's contribution. This assumes steady-state linear PK with unchanged dose and other pathways. It does not replace whole-body PBPK incorporating hepatic flow, intestinal metabolism, transport or self-inhibition.
Different assumptions about \(B\) and \(r\) permit different \(f_m\) values for the same AUC ratio. For \(R=2.6\) and complete inhibition \(r=0\), \(B=1\) gives \(f_m=0.615\), whereas \(B=1.5\) gives \(f_m=0.423\).
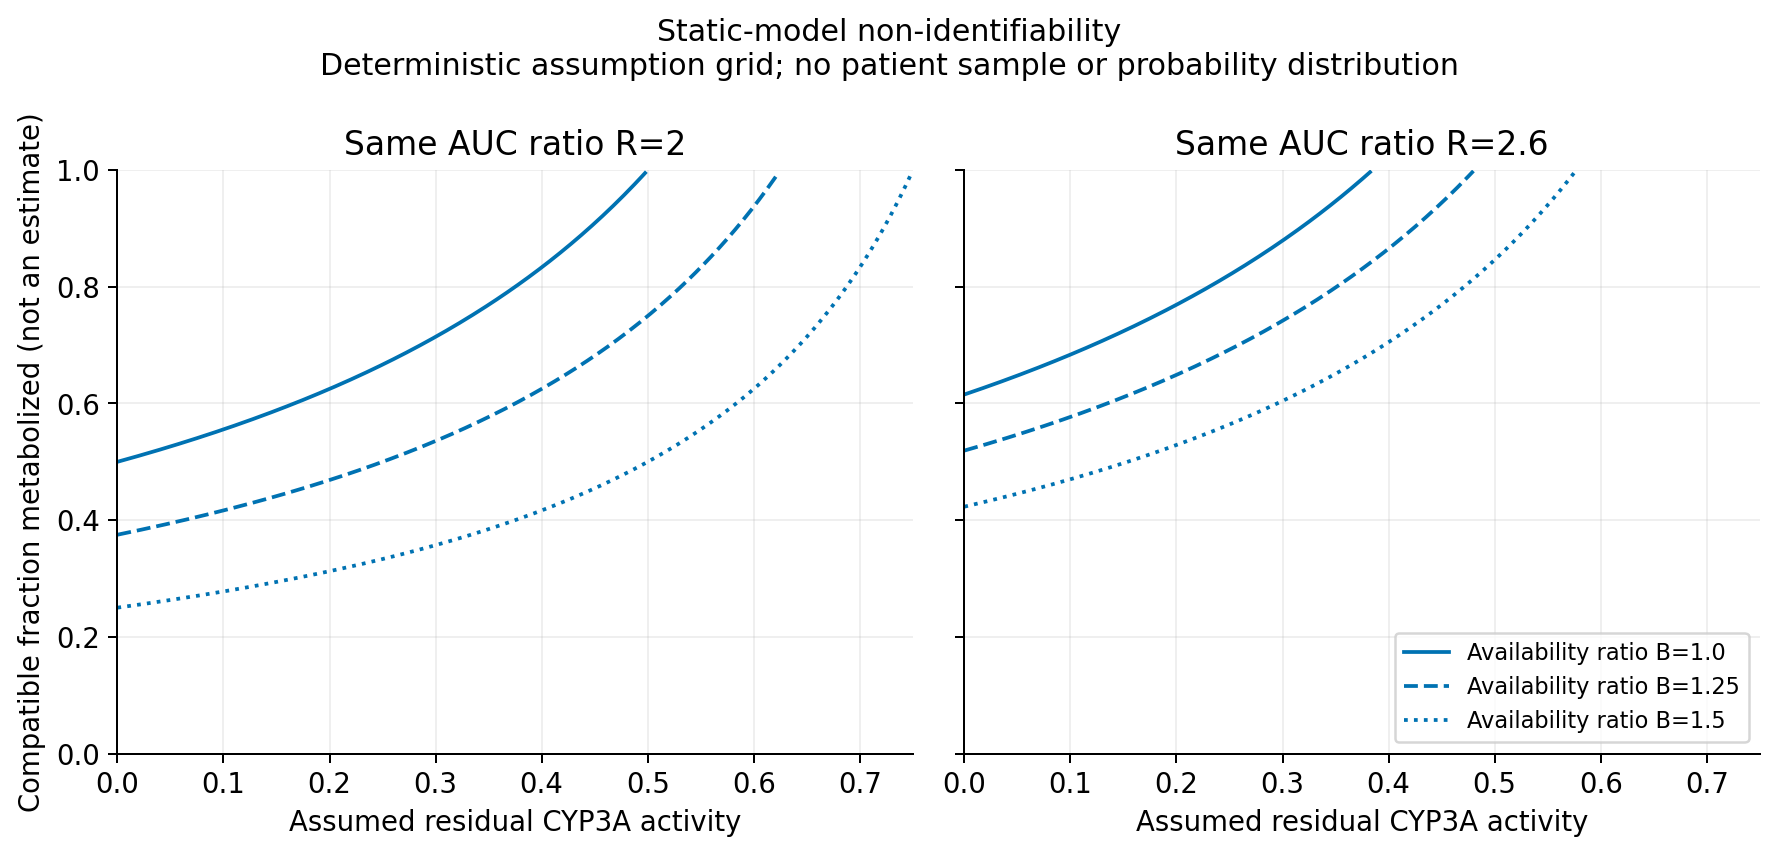
Figure 3. Reduced-model non-identifiability. Assumed \(B,r\) combinations give the same AUC with different \(f_m\). Lines are neither probability distributions nor confidence intervals.
This does not establish that PBPK cannot infer mechanisms. It shows that one AUC number does not uniquely assign inhibition strength, metabolic contribution and absorption change within this model. Absolute bioavailability, IV clearance, mass balance and absorption/transport information can narrow the combinations.
Discussion
The 2026 ziftomenib paper describes its model as validated. FDA's PBPK assessment instead considered patient-PK verification of \(f_m\) insufficient given sparse sampling, small groups, high variability and concomitant drugs. FDA also considered in vitro data, mass balance and absolute bioavailability under conservative scenarios. Support for label wording does not validate every assumption (3, 4).
The FDA review was published in 2025 and the paper in 2026; this does not mean FDA rejected a later paper. Timing and intended use differ between sources.
For revumenib, parent-drug agreement does not establish prediction of metabolite M1. M1 contributes to QTc effects, and FDA raised concerns about model performance with inhibitors other than cobicistat. Matching parent AUC therefore does not establish reproduced QT risk (FDA review, printed pp. 287–293, 5).
Limitations
Joint individual concentration, covariate and azole-exposure data were unavailable; NLME, IIV and E–R models were not reestimated. Direct retrieval of the paper's supplement returned 403. Missing information prevents reconciliation of model-condition differences. Public-result discrepancies cannot be treated as causal drug differences or independent clinical validation.
An auxiliary diagnostic asking whether label-summary half-lives support representative one-compartment curves is retained in the notebook and supplement notes. The main conclusions do not rely on that diagnostic. Reduced-model non-identifiability is an explanatory calculation of a known property, not a new pharmacological discovery.
Conclusion
Drugs sharing a target differ in metabolic contribution, absorption and coadministration conditions. These sources do not support a class-wide AUC multiplier; AUC agreement did not guarantee Cmax agreement or performance under unused inhibitor conditions.
Borrowing is not inherently invalid, but different mechanisms can generate the same multiplier and yield different extrapolations. That unresolved ambiguity prevents using an existing drug's multiplier as an established safety prediction for a new one.
Verification and code availability
Input CSVs, analysis functions, plotting code and an executed notebook are retained in the production workspace. Ten checks covered unit conversions, inverse calculations, numerical peak bounds, rounding and boundaries. Calculations use deterministic grids without randomness.
Distributed functions
The ZIP of analysis functions and unit checks excludes source data and full-analysis reproduction materials. Constructed examples check implementation, not clinical-data validity.
References
- DailyMed. REVUFORJ (revumenib): US prescribing information [Internet]. Revised 2026 Feb; version 5. Prescribing information.
- US Food and Drug Administration. KOMZIFTI (ziftomenib): US prescribing information. 2025 Nov. Approved label.
- Templeton IE, Litou C, Jones HM, Ahsan JM, Tabachri M, Leoni M, et al. A Practical Alternative to Refine the Estimate of fmCYP3A4 and Evaluate Drug–Drug Interaction Potential for Ziftomenib Using PBPK Modeling to Inform Labeling. CPT: Pharmacometrics & Systems Pharmacology. 2026;15(9):e70327. doi:10.1002/psp4.70327.
- US Food and Drug Administration. KOMZIFTI: NDA 220305 multidisciplinary review. 2025. Assessment report.
- US Food and Drug Administration. REVUFORJ: NDA 218944 multidisciplinary review. 2024. Assessment report.