Predicting intestinal T-cell engager responses across organoid donors
A donor-level reanalysis of public normal intestinal organoid data compares mean, tissue-region and CEA-area regressions using held-out donor prediction at a fixed TCE concentration.
On this page
- The outcome is a 48-hour caspase signal
- EpCAM values are not pooled
- Comparing four small models
- Expression improves prediction over the mean
- Donors, rather than tissue regions, were excluded
- Does improvement depend on one donor?
- What a normal-tissue average leaves out
- Data and code availability
- References
A low average response in a small set of normal-tissue cultures does not establish that other donors will respond similarly. A strongly responding donor may simply be absent. If target expression explains some of the variation, retaining that information changes how the measurements can be interpreted.
This reanalysis uses public data from 14 normal intestinal organoid donors to predict the response to a carcinoembryonic-antigen (CEA)-targeting T-cell engager (TCE) at 48 hours. The leave-one-donor-out root mean squared error (RMSE) was 0.519 for a donor-mean baseline and 0.253 for a regression using CEA-positive immunohistochemistry (IHC) area. These are predictions for another donor within the same fixed-concentration culture study, not predictions of patient adverse events or clinical dose.
The outcome is a 48-hour caspase signal
The question is whether CEA expression predicts an unused normal intestinal organoid donor’s TCE response more accurately than a donor-mean baseline. This examines the consequence of reducing donor differences to an average in nonclinical normal-tissue assessment.
Harter and colleagues used normal intestinal organoids co-cultured with peripheral blood mononuclear cells (PBMCs) to study TCE effects on normal tissue. The input here is the Source Data for the original Figure 5. Fourteen donors treated with the high-affinity CEA-targeting T cell bispecific antibody (TCB) CEA(hi) TCB at 0.5 µg/mL were analyzed (1).
The outcome is the 48-hour caspase-3/7 fluorescence signal divided by the mean non-targeting TCB signal at that time. It is a dimensionless signal ratio, not a dead-cell fraction or the probability of treatment-related enteritis.
Table 1. Inputs and prediction unit.
| Item | Information used |
|---|---|
| Prediction unit | 14 organoid donors |
| Tissue region | Seven small-intestine and seven colon donors |
| Molecule and condition | CEA(hi) TCB; 0.5 µg/mL; 48 hours |
| Target measure | Donor-mean CEA-positive IHC area |
| Outcome | Caspase-3/7 signal normalized to non-targeting TCB |
| Original data | Figure 5 Source Data sheets b, d_CEA, e and f |
Multiple organoids were quantified for IHC in each donor. Those organoids were not entered as independent donor replicates in the regression. The validation concerns different organoid donors; it does not evaluate replacing the PBMC donor.
EpCAM values are not pooled
The downloaded Source Data contain inconsistent donor-linked epithelial cell adhesion molecule (EpCAM) values across sheets. Comparing the original Figure 5f donor labels with 5b gives response discrepancies in nine of 14 records; comparing the IHC means with 5d gives discrepancies in 13 of 14. For example, the response labeled Donor 40 is 1.980381 in 5b and 2.732068446 in 5f. This analysis does not decide which label is correct or silently repair the mapping.
All 14 CEA(hi) responses in 5f agree with the corresponding donors in 5b. The CEA area means calculated from 5d also agree with the rounded values in 5f. The regression is therefore restricted to CEA(hi). No additional linked table is assumed for CEA(lo). The source-sheet differences are preserved in excluded_epcam_audit.csv in the companion material (original Figure 5 and Source Data).
Comparing four small models
Let \(A_i\) be the CEA-positive area of donor \(i\), \(R_i\) equal one for colon and zero for small intestine, and \(y_i\) be the normalized caspase signal. Four models were compared:
\[ \begin{aligned} M_0 &: y_i=\beta_0+\epsilon_i\\ M_R &: y_i=\beta_0+\beta_R R_i+\epsilon_i\\ M_A &: y_i=\beta_0+\beta_A A_i+\epsilon_i\\ M_{AR} &: y_i=\beta_0+\beta_A A_i+\beta_R R_i+\epsilon_i \end{aligned} \]
Coefficients were estimated by equally weighted least squares. With only 14 donors, no interaction, quadratic term or threshold search was added. This is an exploratory retrospective comparison of four models, not a preregistered validation.
One donor was excluded, coefficients were fitted using the remaining 13, and the excluded donor was predicted. This was repeated 14 times. The mean model also uses the training mean from the relevant 13 donors, not the mean of all 14. Target expression is assumed to have been measured when the prediction is made.
\[ \mathrm{RMSE}=\sqrt{\frac{1}{14}\sum_{i=1}^{14}(y_i-\widehat y_{i,-i})^2} \]
Expression improves prediction over the mean
Prediction errors are summarized by RMSE and mean absolute error (MAE), both in normalized signal-ratio units.
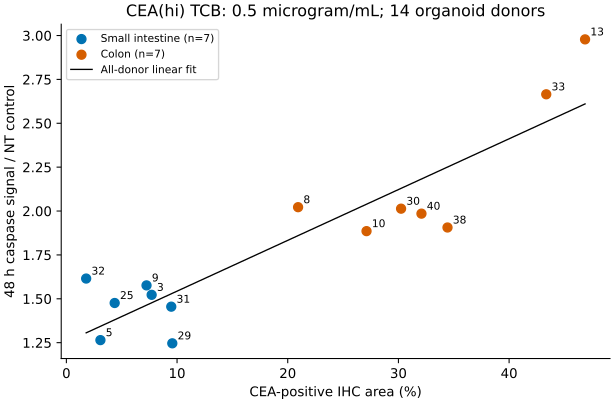
Figure 1. CEA-positive area and normalized 48-hour caspase signal. CEA-positive area ranged from 1.789% to 46.862%, and normalized caspase signal from 1.246 to 2.978. The line is an all-donor fit, not a held-out prediction line. Numbers identify the public organoid-donor labels.
Table 2. Training and held-out donor prediction errors.
| Model | Coefficients | Training RMSE | Held-out donor RMSE | Held-out donor MAE |
|---|---|---|---|---|
| Mean | 1 | 0.482 | 0.519 | 0.408 |
| Tissue region | 2 | 0.298 | 0.348 | 0.270 |
| CEA-positive area | 2 | 0.206 | 0.253 | 0.214 |
| CEA-positive area and tissue region | 3 | 0.201 | 0.283 | 0.230 |
The CEA-area model reduced held-out donor RMSE by 51.3% relative to the mean model. Maximum absolute prediction error was 1.237 for the mean model and 0.526 for the CEA model. These errors are in signal-ratio units, not percentage points.
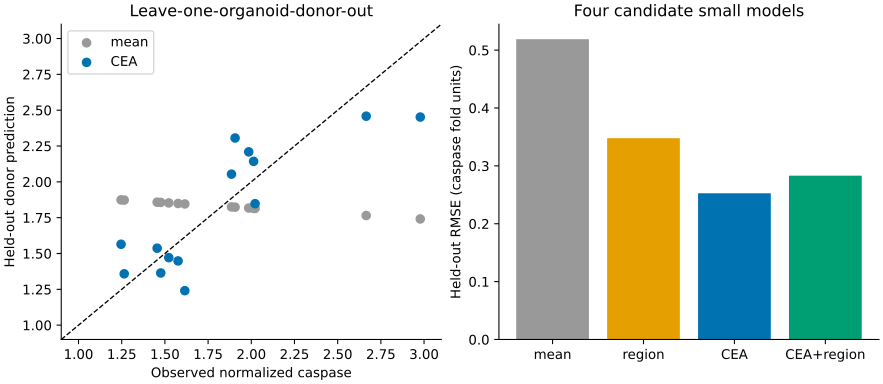
Figure 2. Predictions for excluded donors and errors across four models. Each donor is predicted using coefficients fitted without that donor. Errors are in dimensionless signal-ratio units.
Adding tissue region to CEA slightly reduced the training error but increased error for unused donors. More explanatory variables did not improve prediction. Tissue region alone also improved on the mean, so the CEA association should not be interpreted as a causal effect independent of tissue region.
Donors, rather than tissue regions, were excluded
In this sample, all seven small-intestine donors had lower CEA-positive areas than all seven colon donors. Excluding one donor leaves other samples from its tissue region in training. The resulting error therefore does not evaluate transfer from one tissue region to another or extrapolation beyond the observed CEA range. Worse performance after adding region also does not establish that region lacks biological relevance.
Four equations were compared, and the smallest exclusion error is emphasized. Even though each coefficient fit excludes the evaluated donor, selecting an equation using those same errors makes the minimum a post-selection result rather than an independent estimate of the selected procedure's performance. This source of optimism is established in cross-validation methodology (2). The 51.3% reduction describes this fixed comparison, not an improvement validated for the entire selection procedure in a new donor cohort.
Does improvement depend on one donor?
Fitting the CEA model to all 14 donors gave:
\[ \widehat y=1.2542+0.02894 A \]
\(A\) is the numerical percentage. A difference of 10 percentage points corresponds to a 0.2894 difference in signal ratio along this line. This is neither a slope for changing concentration nor a slope against the number of cell-surface molecules.
Table 3. CEA-model coefficients and bootstrap intervals.
| Coefficient | Estimate | Donor-bootstrap 2.5th–97.5th percentiles |
|---|---|---|
| Intercept | 1.2542 | 1.0635–1.4267 |
| Per percentage point of CEA-positive area | 0.02894 | 0.01754–0.03638 |
The bootstrap resampled 14 donors with replacement and refitted the model 2,000 times. The interval describes coefficient uncertainty conditional on the small observed donor sample and the linear model. It is neither an interval for clinical response nor a prediction interval for a new patient.
As an additional sensitivity analysis, one donor was removed from the entire dataset before repeating leave-one-donor-out prediction within the remaining 13. CEA-model RMSE was lower than mean-model RMSE in all 14 deletions. Improvement therefore did not require inclusion of any single donor. The deletions are not 14 independent external validations.
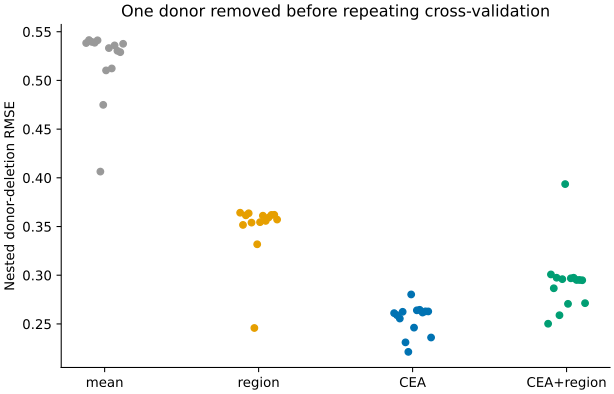
Figure 3. RMSE after removing one donor from the dataset and repeating donor-exclusion prediction within the remaining 13. The 14 deletions use overlapping data and are sensitivity analyses, not independent external validations.
IHC areas and response ratios are means of measured quantities, but measurement error in the predictor and uncertainty from the control-signal denominator are not modeled separately. Donor resampling does not repeat staining, wells or control measurements within a donor. Coefficient intervals are also not intervals for differences in predictive error between models.
What a normal-tissue average leaves out
At this fixed concentration, the CEA IHC measurement predicted a different donor more accurately than carrying forward a donor average. Summarizing the assay only by its mean can miss response differences when the normal-tissue target-expression distribution changes.
IHC-positive area, however, is not cell-surface antigen density. Increased caspase signal is not a tissue-wide dead-cell fraction or a patient's risk of enteritis. Image processing, the control signal, organoid differentiation and immune-cell interactions can also affect the measurement. The regression does not separate these mechanisms.
This internal validation compared model performance using 14 donors from one study. Transfer to a different laboratory, PBMC donor, molecule or concentration was not validated. In particular, this fixed-concentration line cannot provide a safe clinical dose or therapeutic window. The supported result is narrower: under this CEA(hi) TCB assay condition, using donor-level CEA-positive area was more predictive than discarding it into an average.
Data and code availability
Analysis code, processed data and result tables
analysis/run.py regenerates the source-sheet correspondence checks, regression, donor-exclusion predictions, bootstrap, figures and tables. outputs/summary.json contains the manuscript numbers, and outputs/tables/heldout_predictions.csv contains every prediction. The original XLSX is downloaded from a public API and checked by SHA-256. The README gives execution steps and dependency versions. Figures are newly drawn from public numerical data; original figures are not reproduced.
References
- Harter MF, Recaldin T, Gerard R, Avignon B, Bollen Y, Esposito C, et al. Analysis of off-tumour toxicities of T-cell-engaging bispecific antibodies via donor-matched intestinal organoids and tumouroids. Nat Biomed Eng. 2024;8(4):345–360. Published online December 19, 2023. doi:10.1038/s41551-023-01156-5. Source Data for Figure 5, CC BY 4.0. Changes: donor-level table extraction, source-sheet concordance checks, regression, cross-validation, bootstrap and new figures.
- Varma S, Simon R. Bias in error estimation when using cross-validation for model selection. BMC Bioinformatics. 2006;7:91. doi:10.1186/1471-2105-7-91.