Gemcitabine infusion duration: plasma AUC and intracellular exposure
On this page
Abstract
Fixed effects from a published clinical PopPK model were used to compare single 30-, 60- and 100-minute gemcitabine infusions at equal doses. Plasma AUC was identical, while PBMC dFdCTP AUC differed under the model's infusion-rate-dependent formation-clearance categories. Fixing formation clearance removed the infinite-time intracellular AUC difference. The apparent gain therefore reflects an assumed relationship in the published model, rather than newly demonstrated benefit of longer infusion. PBMC exposure, tumor activation and clinical outcomes remain distinct.
Literature checked on October 12, 2026.
Introduction
Gemcitabine enters cells and is phosphorylated into active metabolites. Increasing plasma parent-drug exposure and increasing intracellular dFdCTP need not be equivalent. Is plasma PK sufficient for comparing longer infusions at the same dose?
dFdCDP also contributes to pharmacological activity (1); this analysis is restricted to dFdCTP represented by the available clinical model.
Single 30-, 60- and 100-minute infusions were compared using published fixed effects. Plasma AUC was unchanged, while PBMC dFdCTP AUC differed. That difference arises from an equation switching formation clearance by infusion rate. It is not new evidence establishing clinical usefulness of prolonged infusion.
Methods
Question and context of use
The quantity of interest is whether equal-dose infusions differ in plasma AUC, peak and PBMC dFdCTP, and whether intracellular differences arise from concentration-profile shape or formation-clearance assumptions.
The context is research comparison of infusion conditions, relevant measurements and choices the model cannot resolve. It does not support treatment changes or clinical-trial dose selection.
The 100-minute infusion is exploratory, not recommended. US prescribing information warns of increased toxicity with infusions longer than 60 minutes and other schedule changes (2). This analysis neither calculates that risk nor supplies evidence to change the warning.
Plasma, PBMCs and tumor are different compartments
The implementation follows Khatri and colleagues, who measured plasma gemcitabine and dFdU and PBMC dFdCTP in 40 patients with solid tumors and estimated PopPK models (3). PBMCs are peripheral blood mononuclear cells, not tumor cells.
A 2020 multiscale PBPK study instead combines pancreatic-cancer-cell metabolic information with physiological scaling to model tumor metabolites (4). That model was not equated with or transplanted into the PBMC model.
Table 1. Calculated compartments and interpretation limits
| Compartment | Calculated here | Not directly established |
|---|---|---|
| Plasma | Gemcitabine AUC and Cmax | Activation, tumor exposure or efficacy |
| PBMC | Relative dFdCTP exposure under published equations | Tumor dFdCTP or clinical benefit |
| Tumor | Not calculated | PBMC results cannot substitute for tumor values |
Implemented subsystem
The two-compartment parent-drug plasma subsystem and three-compartment PBMC dFdCTP subsystem were independently implemented. The dFdU branch was omitted because it does not feed back into either. This is neither whole-body PBPK nor reproduction of every original NONMEM setting, and no patient-level refitting was performed.
Reference conditions were body surface area 1.76 m², age 70 and the paper's reference genotypes: NT5C2 CC/CT carrying a minor allele, and SLC28A3 without its 1.77-fold formation-clearance effect. The dose was 1,000 mg/m², totaling 1,760 mg. Every condition is a single infusion starting from zero drug amounts.
Table 2. Parameters used for the reference calculation
| Parameter | Value | Original source |
|---|---|---|
| Plasma total CL, central V, Q, peripheral V | 425 L/h, 114 L, 10.1 L/h, 101 L | Table 2 |
| PBMC formation CL | 0.061 or 0.118 L/h | Table 4 |
| PBMC elimination CL, central V | 0.00131 L/h, 0.005 L | Table 4 |
| PBMC peripheral compartment 1 Q, V | 0.206 L/h, 0.0288 L | Table 4 |
| PBMC peripheral compartment 2 Q, V | 0.00126 L/h, 0.0877 L | Table 4 |
Writing plasma concentrations as \(C_c,C_p\) and PBMC central/peripheral concentrations as \(M_c,M_j\), amount equations are
\[ \frac{dA_c}{dt}=R_{in}-CL\,C_c-Q(C_c-C_p) \]
\[ \frac{dA_p}{dt}=Q(C_c-C_p) \]
\[ \frac{dB_c}{dt}=CL_f C_c-CL_e M_c-\sum_{j=1}^{2}Q_j(M_c-M_j) \]
\[ \frac{dB_j}{dt}=Q_j(M_c-M_j) \]
Each concentration is its corresponding amount divided by volume. Formation clearance is already included in published total plasma clearance and is not added again to parent elimination.
Internal amounts use gemcitabine-equivalent mg: a common scaling of molar amounts, not chemical mass of dFdCTP itself. Intracellular figures and tables show ratios to the 30-minute condition rather than absolute values suggesting measured patient PBMC concentrations.
Results
Equal plasma AUC with lower peaks
Table 3. Equal-dose infusion comparisons under fixed effects
| Infusion duration | Rate mg/m²/min | Plasma AUC∞ mg·h/L | Plasma Cmax mg/L | PBMC AUC∞ ratio | PBMC AUC0–72 ratio | PBMC Cmax ratio |
|---|---|---|---|---|---|---|
| 30 min | 33.33 | 4.141 | 6.892 | 1.000 | 1.000 | 1.000 |
| 60 min | 16.67 | 4.141 | 3.961 | 1.934 | 1.933 | 1.920 |
| 100 min | 10.00 | 4.141 | 2.429 | 1.934 | 1.930 | 1.892 |
All values are calculations with fixed effects. Intracellular ratios use 30 minutes as reference. AUC∞ runs from infusion initiation through complete elimination; AUC0–72 uses the same 72-hour window after initiation. The latter differs from the paper's sampling endpoint 72 hours after infusion completion.
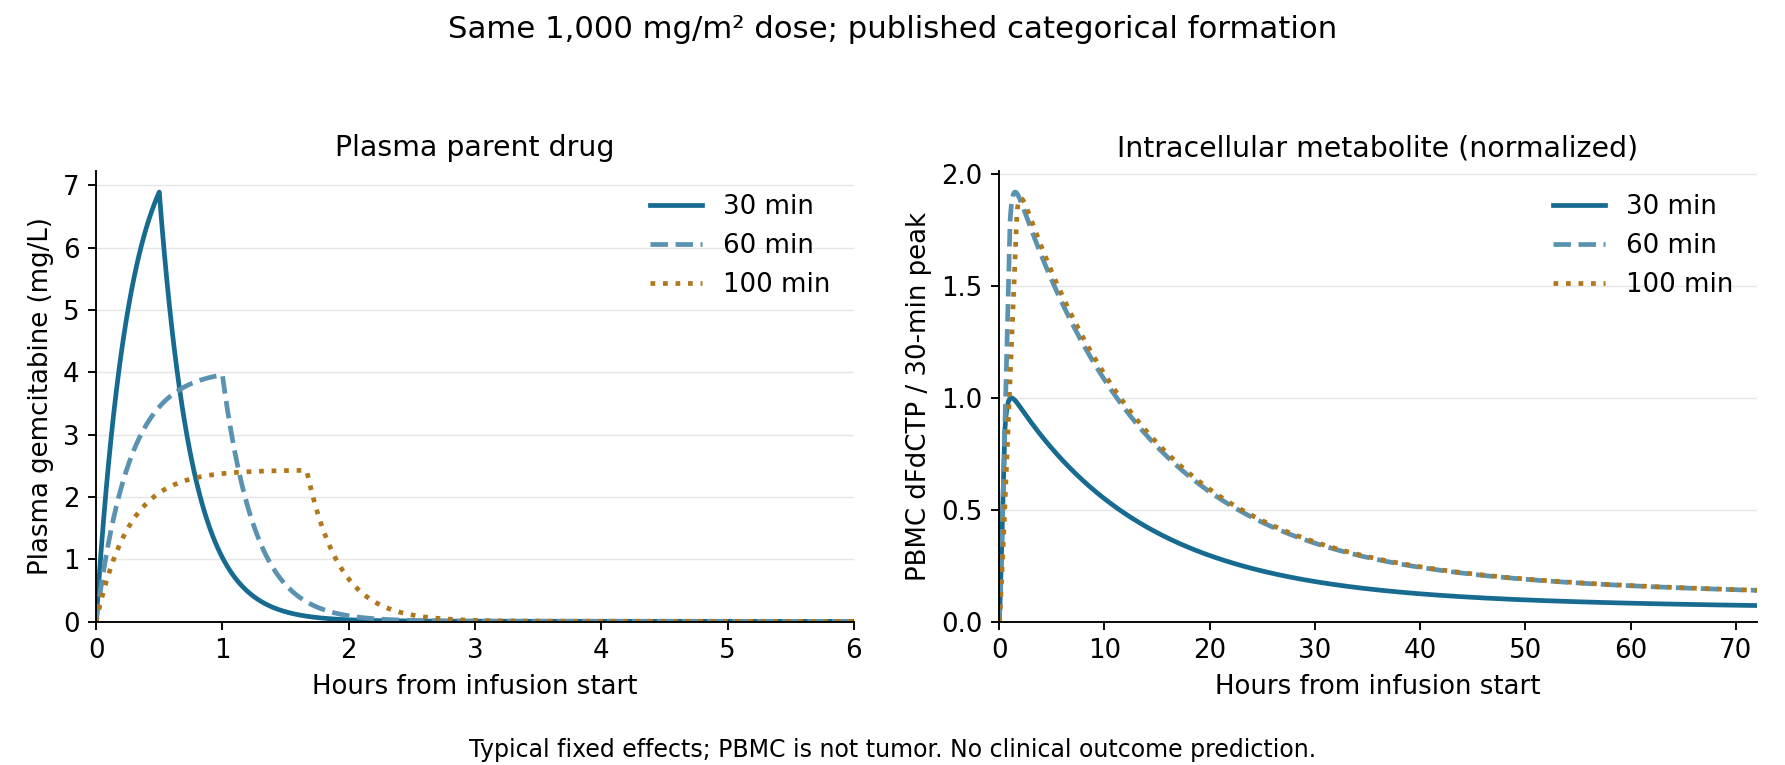
Figure 1. Plasma and PBMC time courses. Left: plasma gemcitabine. Right: PBMC dFdCTP normalized to the 30-minute-condition peak. Time axes differ. The right panel uses published infusion-rate categories and does not predict tumor exposure or efficacy.
Plasma peaks fall as infusion lengthens. Plasma AUC∞ is identical because a linear constant-clearance model with complete elimination implies
\[ AUC_{plasma,\infty}=\frac{Dose}{CL} \]
That structural property does not establish clinical equivalence. Additional duration-dependent distribution changes outside the paper were not introduced.
Source of the nearly twofold intracellular AUC difference
Formation is linear in the selected model, with \(CL_f\) switched by infusion rate \(ROI\):
\[ CL_f=\begin{cases} 0.118 & ROI<25\ \mathrm{mg/m^2/min}\\ 0.061 & ROI\geq25\ \mathrm{mg/m^2/min} \end{cases} \]
Exactly 25 was assigned to the higher-rate category as an implementation convention, not an independently validated biological boundary. The paper tested multiple cutoffs and selected a value giving substantial improvement in fit. Linear formation was ultimately selected over a saturable alternative (3).
Integrating through complete elimination gives, for the PBMC central compartment,
\[ AUC_{PBMC,\infty}=\frac{CL_f}{CL_e}AUC_{plasma,\infty} \]
Transfers to peripheral compartments cancel in the net full-time integral. The AUC ratios for 60 and 100 minutes are therefore predetermined by \(0.118/0.061\).
A diagnostic scenario fixed formation clearance at 0.061 L/h regardless of duration.
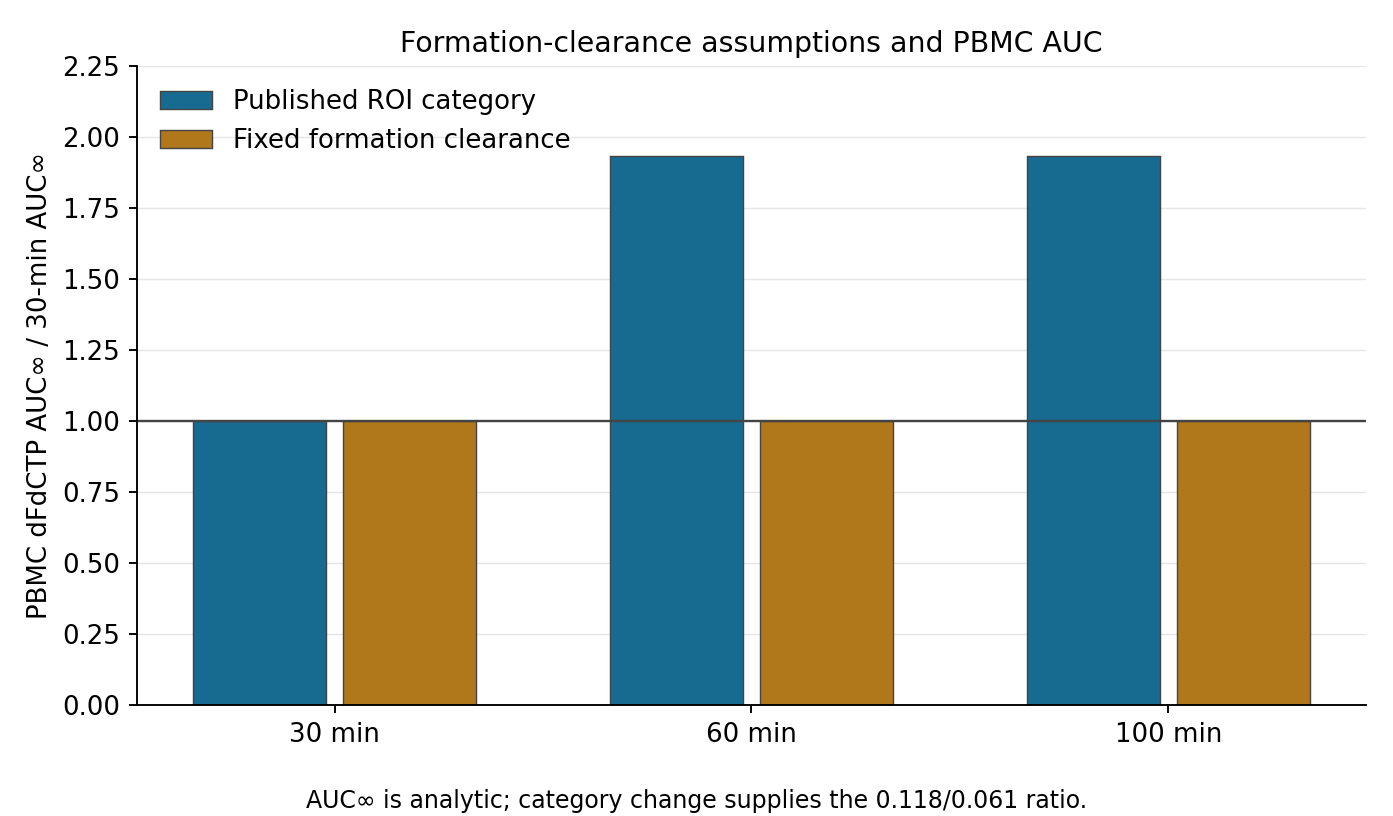
Figure 2. Formation-clearance assumptions. Blue uses published rate categories; gold fixes formation clearance. Plasma AUC is equal throughout. The fixed-clearance scenario is an assumption change identifying the source of the difference, not a clinically validated alternative model.
Fixing formation clearance also equalized intracellular AUC∞. The gain does not emerge from continuous mechanistic calculations of transport and phosphorylation: it reflects the formation-clearance contrast associated with infusion-rate categories. That observational association cannot identify a causal effect of duration alone.
The model places 60 and 100 minutes in the same category, so extending between them adds no AUC∞. Peaks and finite-window AUC differ slightly; increasing duration does not imply progressively greater activation.
Category boundary and extrapolated tails
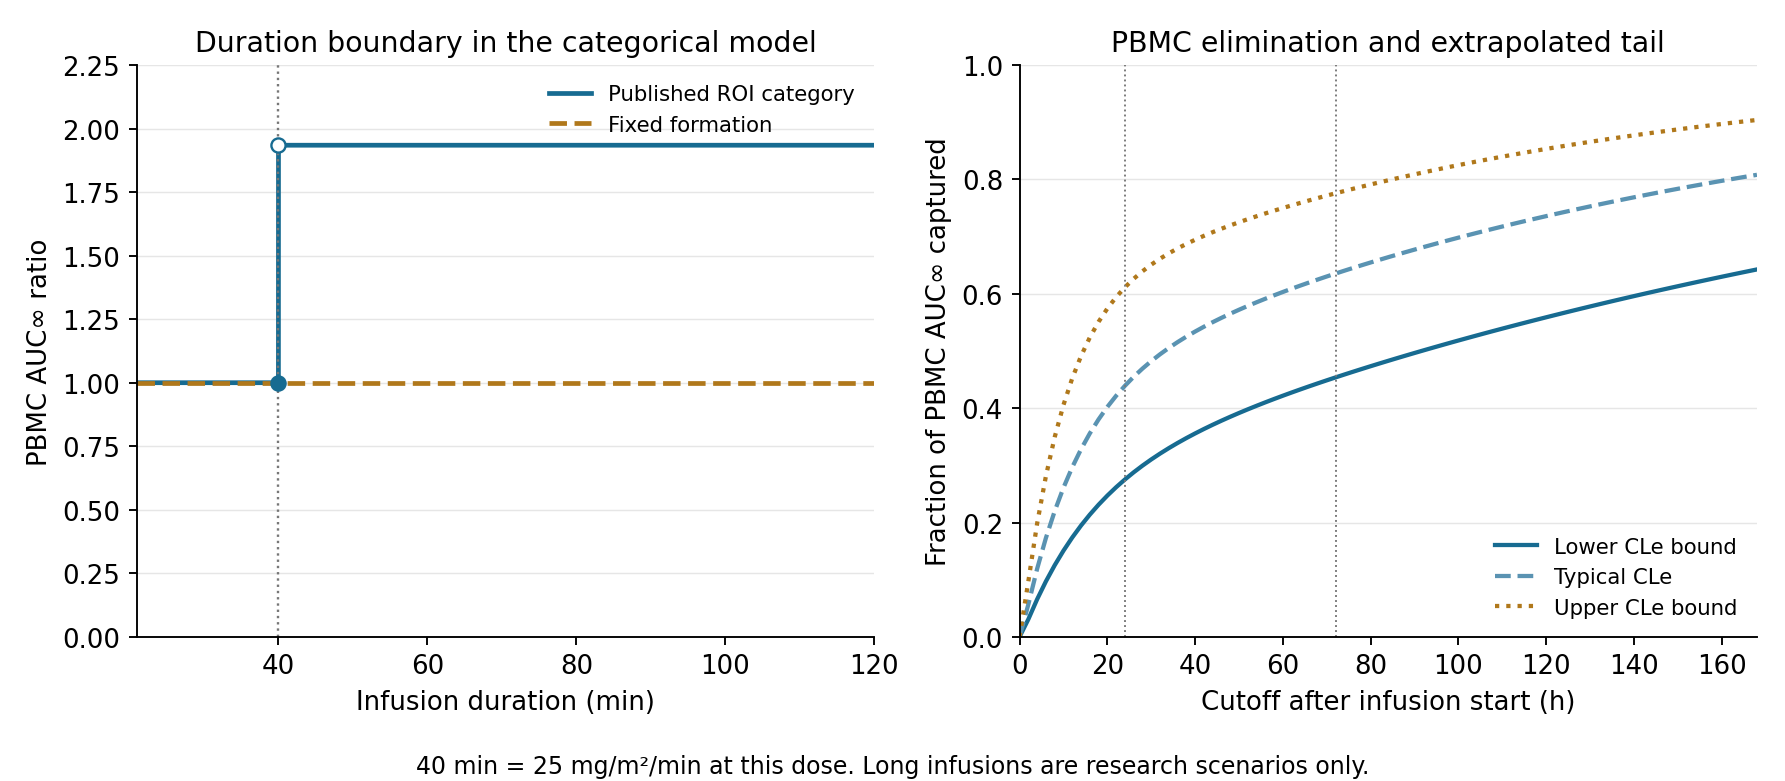
Figure 3. Boundary and tail scenarios. Left: AUC ratio by duration. At 1,000 mg/m², 40 minutes corresponds to 25 mg/m²/min. Right: fractions of AUC∞ captured by each time in the 30-minute condition when only PBMC elimination clearance is set to its published bootstrap lower bound, estimate or upper bound. These are not confidence intervals.
The discontinuity around 40 minutes is imposed by the categorical equation, not discovery of an optimal duration. Whether actual formation changes abruptly across that boundary cannot be determined by this calculation.
In the 30-minute condition, PBMC AUC through 24 hours was 43.9% of AUC∞ and through 72 hours was 63.5%. These fractions are model integrals, not patient measurements verifying the proportions.
AUC∞ partly extrapolates beyond observation. Integrals within a short sampling window and those including a long extrapolated tail require separate interpretation; the latter depend on elimination and distribution assumptions.
Fifty-four scenarios varied marginal bootstrap bounds from original Tables 2 and 4 one at a time. Combining low- and high-rate formation-clearance bounds produced corner AUC ratios of 0.70–5.73. These mechanically combine two marginal ranges and are not a 95% interval for the ratio. The original joint bootstrap distribution would be needed. No independent virtual-patient sampling was presented as a clinical predictive interval.
Numerical implementation checks
Matrix-exponential solutions were checked against an independent ODE solver. Finite-time integrals plus residual-amount tails agreed with analytic AUC∞. Six tests covered fixed formation clearance, continuity at infusion completion, the rate boundary and prevention of double counting. Article values and figures were generated by analysis/run_analysis.py and CSV outputs.
Discussion
In E6201, fixed-dose-rate treatment did not meet the prespecified significance criterion for improved survival and produced more myelosuppression. The standard 1,000 mg/m² over 30 minutes and fixed-rate 1,500 mg/m² over 150 minutes also differ in total dose (5). This equal-dose calculation is neither a reanalysis of E6201 nor clinical validation of duration alone.
The August 2026 TIGeR-PaC substudy compares regional arterial and intravenous administration and measures plasma gemcitabine and dFdU (1). It supplies neither PBMC nor tumor dFdCTP measurements for this calculation. Delivery strategies remain under study, but plasma changes alone do not determine tumor activation.
These calculations were not revalidated using patient observations. They omit parts of the original covariate model, interindividual variability and residual error and do not calculate tumor concentrations, toxicity or survival. The fixed PBMC central volume follows the paper's cell-count and volume assumptions, rather than an individual measured volume.
Conclusion
Higher intracellular exposure after longer infusion reflects the published formation-clearance categories, not separate estimation of transport and phosphorylation rates. The intracellular quantity is PBMC dFdCTP. Neither an equivalent tumor increase nor its consequences for efficacy and myelosuppression follow from these calculations.
Plasma AUC alone did not distinguish the infusions; adding intracellular AUC still left its difference dependent on activation assumptions. Lower peaks and higher metabolite exposure cannot be counted as the same benefit, and this comparison does not determine a preferable clinical infusion duration.
Data and code availability
Figures, numerical tables and code were independently created. Original paper figures, patient data and supplements are excluded from the calculation code, tables and reproduction instructions.
References
- Novelli PM, Zervos EE, Zureikat AH, Pishvaian MJ, Meredith K, Hatoum H, et al. Pharmacokinetic and pharmacodynamic sub-study of trans-arterial vs. intravenous gemcitabine in the TIGeR-PaC phase 3 clinical trial. Cancer Chemotherapy and Pharmacology. 2026;96(1):91. doi:10.1007/s00280-026-04939-0.
- DailyMed. Gemcitabine injection, solution: US prescribing information [Internet]. Revised 2025 Sep [cited 2026 Oct 28]. Section 5.1. Prescribing information.
- Khatri A, Williams BW, Fisher J, Brundage RC, Gurvich VJ, Lis LG, et al. SLC28A3 genotype and gemcitabine rate of infusion affect dFdCTP metabolite disposition in patients with solid tumours. British Journal of Cancer. 2014;110(2):304–312. doi:10.1038/bjc.2013.738.
- Garcia‐Cremades M, Melillo N, Troconiz IF, Magni P. Mechanistic Multiscale Pharmacokinetic Model for the Anticancer Drug 2’,2’-difluorodeoxycytidine (Gemcitabine) in Pancreatic Cancer. Clinical and Translational Science. 2020;13(3):608–617. doi:10.1111/cts.12747.
- Poplin E, Feng Y, Berlin J, Rothenberg ML, Hochster H, Mitchell E, et al. Phase III, Randomized Study of Gemcitabine and Oxaliplatin Versus Gemcitabine (fixed-dose rate infusion) Compared With Gemcitabine (30-minute infusion) in Patients With Pancreatic Carcinoma E6201: A Trial of the Eastern Cooperative Oncology Group. Journal of Clinical Oncology. 2009;27(23):3778–3785. doi:10.1200/JCO.2008.20.9007.