Do fixed doses of anti-PD-1 antibodies keep exposure in range at extreme body weights?
On this page
Abstract
Published population PK models for pembrolizumab and nivolumab were applied to a general-adult weight distribution to compare flat and weight-based exposure. Under the specified model-derived exposure criteria, more than 10% fell below the trough floor at about ≥150 kg for pembrolizumab 200 mg and ≥100–120 kg for nivolumab 240 mg. Weight-based regimens gave lower first-interval troughs in light subjects. Extended-interval assessments depended on using trough versus average concentration. These criteria are proxies derived from models of trial-tested regimens, not efficacy or toxicity thresholds. Exposure differences do not establish clinical effect differences or recommended doses.
Introduction
For the anti-PD-1 antibodies pembrolizumab and nivolumab, dosing moved from weight-based doses (2 mg/kg, 3 mg/kg) to flat doses (200 mg, 240 mg), and regimens with longer intervals (400 mg Q6W, 480 mg Q4W) were added. For patients near the middle of the weight distribution, exposure is almost the same under any regimen. The concern is the two ends of the distribution: very light and very heavy patients.
The move to flat dosing was justified for both drugs by population-PK comparisons of exposure.
- Pembrolizumab 200 mg: Exposure was lowest in heavier patients (above 90 kg) but remained within the exposure range for which near-maximal efficacy was shown at 2 mg/kg (1).
- Pembrolizumab 400 mg Q6W: The average concentration was nearly the same as with 200 mg Q3W, and fewer than 1% of patients fell below the troughs observed with the Q3W regimen (2).
- Nivolumab 240 mg: Chosen as the equivalent of 3 mg/kg at 80 kg, with a median and distribution of exposure similar to 3 mg/kg (3).
- Nivolumab 480 mg Q4W: Compared with 3 mg/kg, the average concentration was similar, the trough about 16% lower and the peak about 45% higher (4).
All of these are comparisons over the whole trial population. This article adds three points.
- It looks only at the ends of the weight distribution (the lowest ~3% below 50 kg and the highest ~1.4% at 150 kg and above).
- It uses the weight distribution of the general adult population (NHANES) rather than the trial populations.
- It fixes what "stays in range" means as a numerical rule before any calculation.
Question and intended use
Question of Interest (QOI): Compared with weight-based dosing, can flat dosing keep exposure within a model-derived reference range based on trial-tested regimens even for patients at extreme body weights?
Context of Use (COU): When considering a switch to flat dosing or a dosing regimen for a new antibody, to narrow down in which weight bands additional confirmation is needed (exposure confirmation at low weight, safety and exposure confirmation at high weight). It is not used to recommend a dose or to assess clinical benefit.
Methods
Exposure criteria
Definition of the range: It was fixed before the calculation as follows.
- Lower limit: The 5th percentile of the steady-state trough (Cmin,ss) when the reference weight-based regimens (pembrolizumab 2 mg/kg Q3W, nivolumab 3 mg/kg Q2W) are given to the same population.
- Upper limit: The median of the steady-state peak concentration (Cmax,ss) at the highest dose tested (10 mg/kg Q2W).
A weight band was judged to "stay in range" if no more than 10% of patients fell below the lower limit and no more than 5% exceeded the upper limit. These limits are proxies for the exposure used in the trials, not thresholds for efficacy or toxicity.
Models and virtual population
Pembrolizumab used the final model of Ahamadi and colleagues, original Table 3 (5).
- Two-compartment, linear, time-invariant CL (typical value 0.22 L/day).
- Weight exponents: 0.595 on CL and Q, 0.489 on Vc and Vp (reference 76.8 kg).
- Females have 15% lower CL and 13% lower Vc.
- Inter-individual variability (IIV): 38% CV on CL, 21% CV on V.
The footnote of the paper's table also gave a formula with different values (CL 0.202, weight exponent 0.578). The exponent 0.578 is the same as the value reported by Freshwater and colleagues (1), who evaluated flat dosing, and is probably from another version of the same model. The values in the table were used for the main analysis and those in the footnote for a sensitivity analysis.
Nivolumab used the final model of Bajaj and colleagues, original Table 1 (6).
- Two-compartment, linear, with CL decreasing over time (by up to about 26%, sigmoid Emax, T50 1,410 hours).
- Weight exponents: 0.566 on CL and 0.597 on VC (reference 80 kg).
- CL is 18% higher in men.
- The inter-individual variabilities of CL and VC are correlated.
Virtual patients: 8,811 adults from NHANES 2017 to March 2020 (7) were resampled with replacement to 20,000 using the survey weights. Actual weight and sex were used; other covariates were set to the reference value of each model. The median weight is 80.7 kg, and the 1st to 99th percentiles are 45.8 to 156.3 kg.
Calculation: - 30-minute infusions were repeated in rxode2, and exposure was obtained in the first dosing interval from week 52 after the start of dosing. - Both drugs have linear PK, so the concentration per 1 mg was computed once and multiplied by the dose of each regimen. - The implementation was checked with 10 tests (for example, the steady-state average concentration matching dose/(CL·τ) and reproduction of the typical values in the papers).
Results
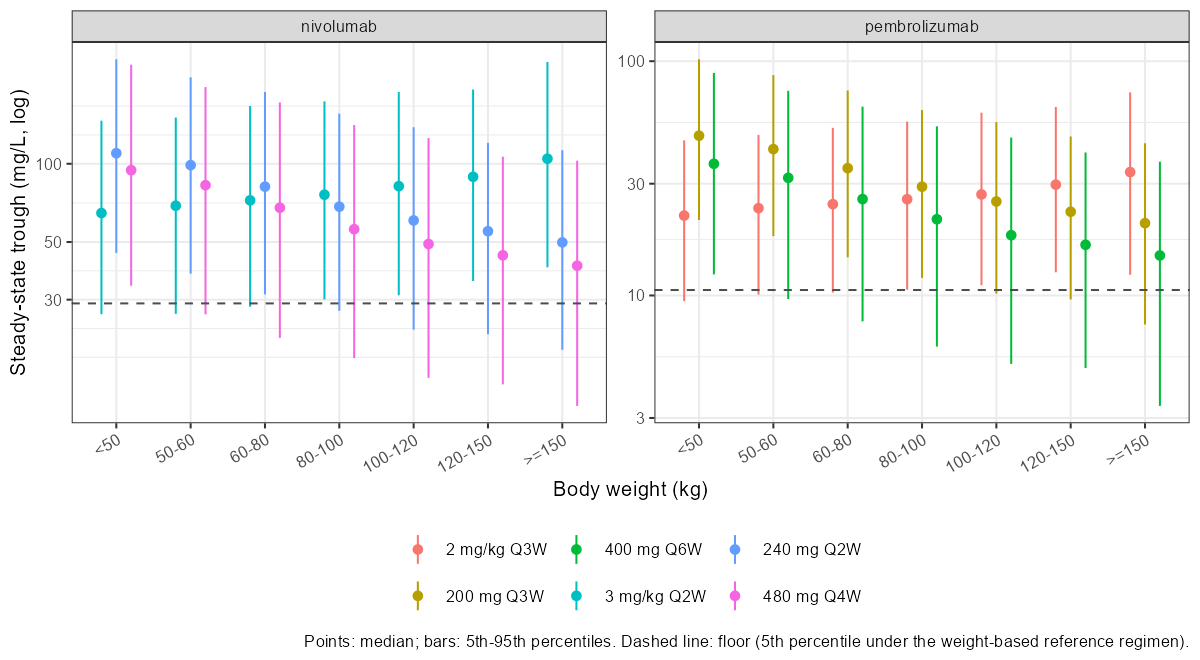
Figure 1. Steady-state troughs by weight band, calculated from published PopPK and an NHANES-derived virtual population rather than observed patient exposure.
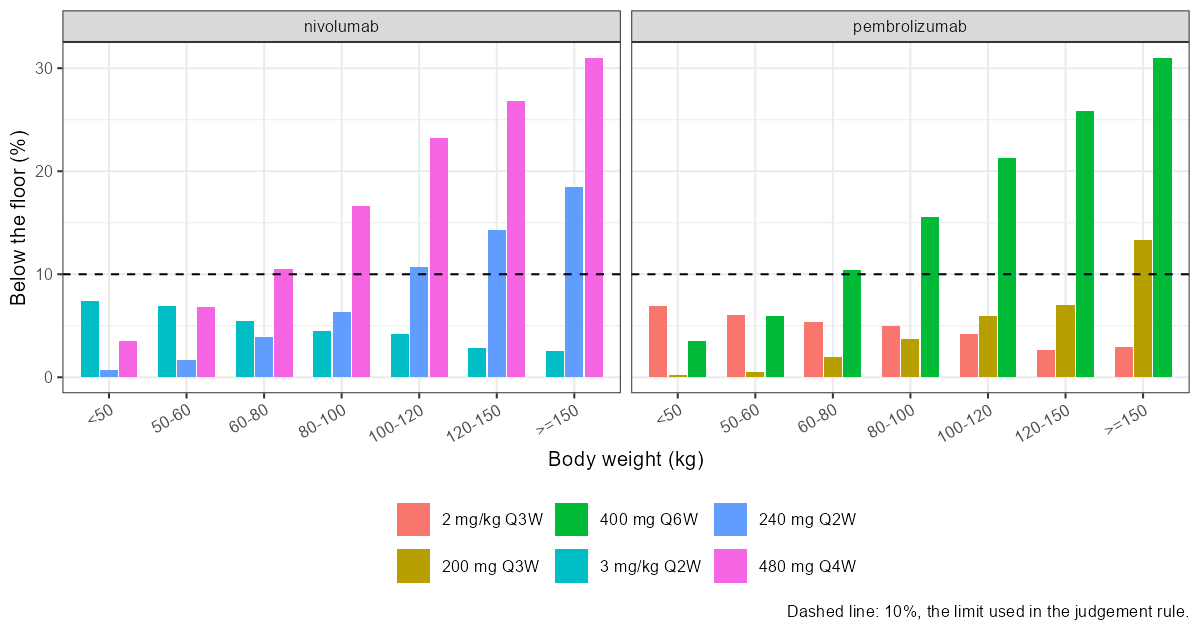
Figure 2. Fractions below the model-derived floor, defined as the fifth percentile of reference-regimen steady-state troughs; it is not an efficacy threshold.
Figure 1 shows trough concentrations; Figure 2 and Table 1 show the fractions below the floor.
Table 1. Proportion below the floor (%)
| Weight | 2 mg/kg Q3W | 200 mg Q3W | 400 mg Q6W | 3 mg/kg Q2W | 240 mg Q2W | 480 mg Q4W |
|---|---|---|---|---|---|---|
| <50 kg | 6.9 | 0.2 | 3.5 | 7.4 | 0.7 | 3.5 |
| 50–60 kg | 6.1 | 0.6 | 6.0 | 6.9 | 1.7 | 6.8 |
| 60–80 kg | 5.4 | 1.9 | 10.4 | 5.5 | 3.9 | 10.6 |
| 80–100 kg | 5.0 | 3.7 | 15.5 | 4.5 | 6.3 | 16.6 |
| 100–120 kg | 4.2 | 5.9 | 21.3 | 4.2 | 10.7 | 23.2 |
| 120–150 kg | 2.6 | 7.0 | 25.8 | 2.9 | 14.2 | 26.8 |
| ≥150 kg | 3.0 | 13.3 | 31.0 | 2.6 | 18.5 | 31.0 |
With flat doses, the trough falls as weight increases. - Weight-based regimens: Met the criterion in every band. - Pembrolizumab 200 mg: Only the band of 150 kg and above was out of range. - Nivolumab 240 mg: The bands of 100 kg and above were out of range. The weight exponent of nivolumab (0.566) is slightly smaller than that of pembrolizumab (0.595), so the exponent does not explain the difference. 240 mg corresponds to 3 mg/kg at 80 kg, and patients heavier than 80 kg receive less than the weight-based amount. In contrast, 200 mg corresponds to 2 mg/kg at 100 kg, and patients up to 100 kg receive the same or more than the weight-based amount. The body weight to which the flat dose is matched determines the margin on the heavy side.
Upper limit: Almost never a problem. The exception was 480 mg Q4W, for which 6.4% in the band below 50 kg and 7.9% of virtual patients at 40 kg exceeded the median peak concentration at 10 mg/kg Q2W.
Light side: The picture reverses. For virtual patients of 40 kg, falling below the lower limit rose to about 12% with weight-based regimens. Limiting to the trough of the first dosing interval, 26% (pembrolizumab) and 31% (nivolumab) fell below the 5th percentile of the first-interval trough of the reference regimen. With flat doses, exposure in light patients is rather higher.
Exposure criteria for extended intervals
For 400 mg Q6W and 480 mg Q4W, more than 10% fell below the lower limit from the 60–80 kg band onward. This is not due to body weight. If the dosing interval is doubled, the trough falls even at the same average concentration. The lower limit here was set from the troughs of the Q3W and Q2W reference regimens.
This is not inconsistent with previous work; the difference lies in how the lower limit is set. Lala and colleagues (2) used the troughs observed with the Q3W regimen (near the lowest values) as the reference and reported that fewer than 1% of patients fell below it. Using the same criterion here (the minimum trough of the virtual patients on the Q3W regimen), 0.06% fell below with 400 mg Q6W. The lower limit in this article is the stricter 5th percentile. Whether the "range" is defined by the minimum or by the 5th percentile changes the assessment of extended-interval regimens a great deal.
As a post hoc check not in the analysis plan, the same judgment was made with the average concentration (Cavg,ss). - Extended-interval regimens: The distribution of the average concentration was identical to that of 200 mg Q3W and 240 mg Q2W, which have the same dosing rate. - Heavy side (150 kg and above): The proportion of flat doses below the lower limit was 13.7% (pembrolizumab) and 22.5% (nivolumab) even when judged by the average concentration.
So the conclusion on the heavy side does not change between trough and average concentration. The assessment of extended-interval regimens, however, depends on the choice of exposure metric itself: whether trough or average concentration is emphasized. Which one to adopt is determined by the exposure–response relationship, not by this model alone.
Sensitivity analyses
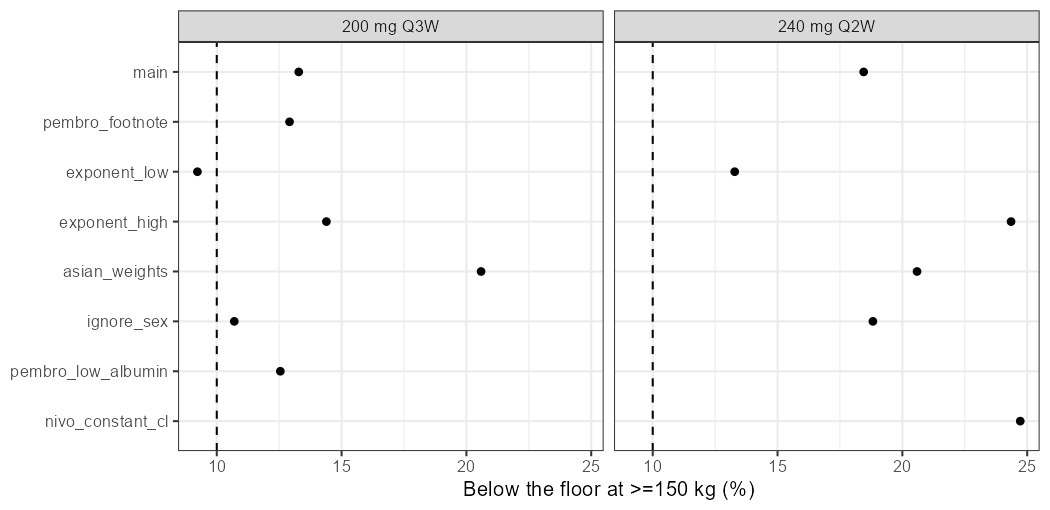
Figure 3. Sensitivity of below-floor fractions at ≥150 kg to individual parameter and population assumptions.
Figure 3 and Table 2 compare sensitivity results in the heavy band.
Table 2. Fractions below the floor at ≥150 kg
| Condition | pembrolizumab 200 mg, ≥150 kg | nivolumab 240 mg, ≥150 kg |
|---|---|---|
| Main analysis | 13.3% | 18.5% |
| Footnote values (CL 0.202, exponent 0.578) | 12.9% | — |
| Weight exponent at the lower end of its 95% CI | 9.2% | 13.3% |
| Weight exponent at the upper end of its 95% CI | 14.4% | 24.4% |
| Asian weight distribution | 20.6% | 20.6% |
| Ignoring sex | 10.7% | 18.8% |
| Low albumin (pembrolizumab) | 12.5% | — |
| Ignoring time-varying CL (nivolumab) | — | 24.7% |
- Judgment on the heavy side: Pembrolizumab fell below 10% only when the weight exponent was set at the lower end of the CI. Nivolumab exceeded 10% under every condition.
- Weight-based regimens: Met the criterion under every condition and in every band.
- Albumin (a covariate other than weight): At 30 g/L, the CL of pembrolizumab is 1.29 times higher. This is comparable to the difference between 100 kg and 150 kg (1.27 times), so body weight is not the only thing that creates the two ends of exposure.
Implementation checks
- Independent recalculation: The exposure computed with rxode2, the core of the calculation, was recomputed with a separate implementation. Across 960 values (30 virtual patients per drug × 4 regimens × 4 metrics), the maximum relative difference was 1.1×10⁻⁵. The separate implementation integrates the differential equations directly dose by dose in Python, without the shortcut of multiplying the concentration per 1 mg.
- Recalculation of the summaries: The lower and upper limits and the proportions by weight band were also recomputed from the exposure file and agreed.
- Comparison with published values: For nivolumab 480 mg Q4W relative to 3 mg/kg, the ratios were 0.98 for average, 0.79 for trough and 1.34 for peak concentration, close to the "similar, about 16% lower, about 45% higher" of Long and colleagues (4). For pembrolizumab, the ratio of average concentration for 400 mg Q6W to 200 mg Q3W was 1.00 (Lala and colleagues report about 1% higher (2)), and the peak of 400 mg Q6W was 31% of that of 10 mg/kg Q2W (Lala and colleagues report about 65% lower (2)).
- Reproducibility: The random seed is fixed, and the same result files are regenerated.
Discussion
Under the models and exposure criteria used here, additional confirmation was indicated for pembrolizumab 200 mg at about 150 kg and above, nivolumab 240 mg at about 100 to 120 kg and above, and the first interval of weight-based regimens at 40 to 50 kg.
- Difference in effect: Whether these exposure differences translate into differences in effect cannot be judged. Exposure–response is reported to be flat for anti-PD-1 antibodies, and whether falling slightly below the lower limit of the range matters clinically lies outside this analysis.
- Differences between populations: NHANES is the US general adult population, not cancer patients or the Japanese weight distribution. With the Asian weight distribution, the results for the heavy bands of the flat doses were rather worse. The number of patients concerned is small, however.
- Covariate correlations: Correlations among covariates such as body weight and albumin cannot be identified from public data and were not included.
Conclusion
High-weight subjects under flat dosing and low-weight subjects in the first interval of weight-based dosing more often fell outside the specified model exposure criteria. Extended-interval judgments also depended on the metric and floor definition. This model comparison using general-adult weights does not establish clinical effect differences in cancer patients or justify dose changes.
Data and code availability
To rerun: Rscript test_analysis.R && Rscript analysis.R && Rscript figures.R && Rscript export_params.R && python validate.py (R 4.5.3, rxode2 5.1.8, ggplot2 4.0.2; Python 3.12, scipy, pandas).
The analysis plan, code, summary results and validation results are included in the distribution files.
References
- Freshwater T, Kondic A, Ahamadi M, Li CH, de Greef R, de Alwis D, et al. Evaluation of dosing strategy for pembrolizumab for oncology indications. J Immunother Cancer. 2017;5(1):43. doi:10.1186/s40425-017-0242-5.
- Lala M, Li TR, de Alwis DP, Sinha V, Mayawala K, Yamamoto N, et al. A six-weekly dosing schedule for pembrolizumab in patients with cancer based on evaluation using modelling and simulation. Eur J Cancer. 2020;131:68–75. doi:10.1016/j.ejca.2020.02.016.
- Zhao X, Suryawanshi S, Hruska M, Feng Y, Wang X, Shen J, et al. Assessment of nivolumab benefit–risk profile of a 240-mg flat dose relative to a 3-mg/kg dosing regimen in patients with advanced tumors. Ann Oncol. 2017;28(8):2002–2008. doi:10.1093/annonc/mdx235.
- Long GV, Tykodi SS, Schneider JG, Garbe C, Gravis G, Rashford M, et al. Assessment of nivolumab exposure and clinical safety of 480 mg every 4 weeks flat-dosing schedule in patients with cancer. Ann Oncol. 2018;29(11):2208–2213. doi:10.1093/annonc/mdy408.
- Ahamadi M, Freshwater T, Prohn M, Li C, de Alwis D, de Greef R, et al. Model-Based Characterization of the Pharmacokinetics of Pembrolizumab: A Humanized Anti-PD-1 Monoclonal Antibody in Advanced Solid Tumors. CPT Pharmacometrics Syst Pharmacol. 2017;6(1):49–57. doi:10.1002/psp4.12139.
- Bajaj G, Wang X, Agrawal S, Gupta M, Roy A, Feng Y. Model-Based Population Pharmacokinetic Analysis of Nivolumab in Patients With Solid Tumors. CPT Pharmacometrics Syst Pharmacol. 2017;6(1):58–66. doi:10.1002/psp4.12143.
- Centers for Disease Control and Prevention, National Center for Health Statistics. National Health and Nutrition Examination Survey 2017–March 2020 Pre-Pandemic [Dataset]. 2021 May. Body Measures (P_BMX); Demographic Variables and Sample Weights (P_DEMO).
Related glossary terms
- Body weight as a covariate (allometric scaling)
- AUC (area under the concentration–time curve)
- Clearance (CL)
- Cmax (peak concentration)
- Ctrough (trough concentration)
- Dosing interval notation: Q2W, Q3W, Q4W and QD
- Exposure–response analysis
- Fixed (flat) dosing versus weight-based dosing
- Inter-individual variability (IIV)
- Reimplementing a published population PK model
- Question of interest (QOI) and context of use (COU)
- Steady state in repeated dosing