How many of Carbon-A's 566 million gene candidates are real?
An audit of the October 18 Carbon-A snapshot distinguishes assembly redundancy, confidence, RefSeq agreement and missing predictions.
On this page
Background and objective
Materials checked on October 18, 2026. This audit uses public prediction files and NCBI data.
On October 8, Hugging Face's biology team released Carbon-A, a 1.2-billion-parameter DNA gene-prediction model, and a database of predictions across eukaryotic GenBank assemblies (1). The announcement describes 566 million protein-coding loci across 48,167 assemblies and 22,617 taxa. An assembly is one reconstruction of a genome, not necessarily a unique species.
I recounted available files to distinguish repeated assemblies, confidence and annotation agreement, and missing predictions. Predicted loci are not automatically newly discovered functional proteins.
Public predictions and their meaning
Carbon-A predicts nucleotide-level coding probabilities in approximately 98,000-base windows. Postprocessing reconstructs one exon path per locus and assigns confidence. RefSeq annotations supply training labels. The announcement reports nucleotide F1 of 0.944 over 42 genomes and AUROC of 0.876 for using confidence to distinguish exact structural matches (1). It acknowledges incomplete reference annotations and that translation and protein function remain unestablished.
Public assembly-level files contain GFF3 gene structures, CDS and translated sequences, and metadata including counts, processed bases and matching RefSeq assemblies (2). Each gene carries structural completeness, based on start/stop codons and length divisible by three, and confidence from 0 to 1.
A RohitAI commentary organizes evidence and claims but explicitly does not analyze released files (3). This article performs that file-based audit. The commentary remains a historical source; its text was not newly retrieved during this revision.
Methods
First, I enumerated 34,060 assemblies with prediction files. Metadata headers supplied gene counts and taxids, which were mapped to species rank with NCBI taxonomy (4). The planned one-assembly-per-species rule selects the newest accession; alternative rules were also compared.
Second, I randomly sampled 20 assemblies from each of six divisions: fungi, invertebrates, plants, protists, mammals and other vertebrates. These 120 assemblies contained approximately 1.58 million genes. GFF files supplied completeness and confidence counts. Division-specific proportions were multiplied by total gene counts; 2,000 bootstrap replicates resampling all divisions produced 95% intervals.
Third, where an identical-sequence RefSeq assembly existed, I randomly selected three distinct species per division, 18 assemblies total. For each prediction, I checked same-strand overlap with a RefSeq CDS and exact exon-boundary agreement with any RefSeq transcript, allowing a three-base stop-codon convention difference. RefSeq may contain multiple transcripts per gene; Carbon-A emits one. I also counted RefSeq genes recovered by overlap.
An initial comparison restricted selection to assemblies with prediction-file sizes at or below the median. Review identified preferential selection of low-yield assemblies, so I resampled without that restriction and retained the initial results as a record.
What the total contains
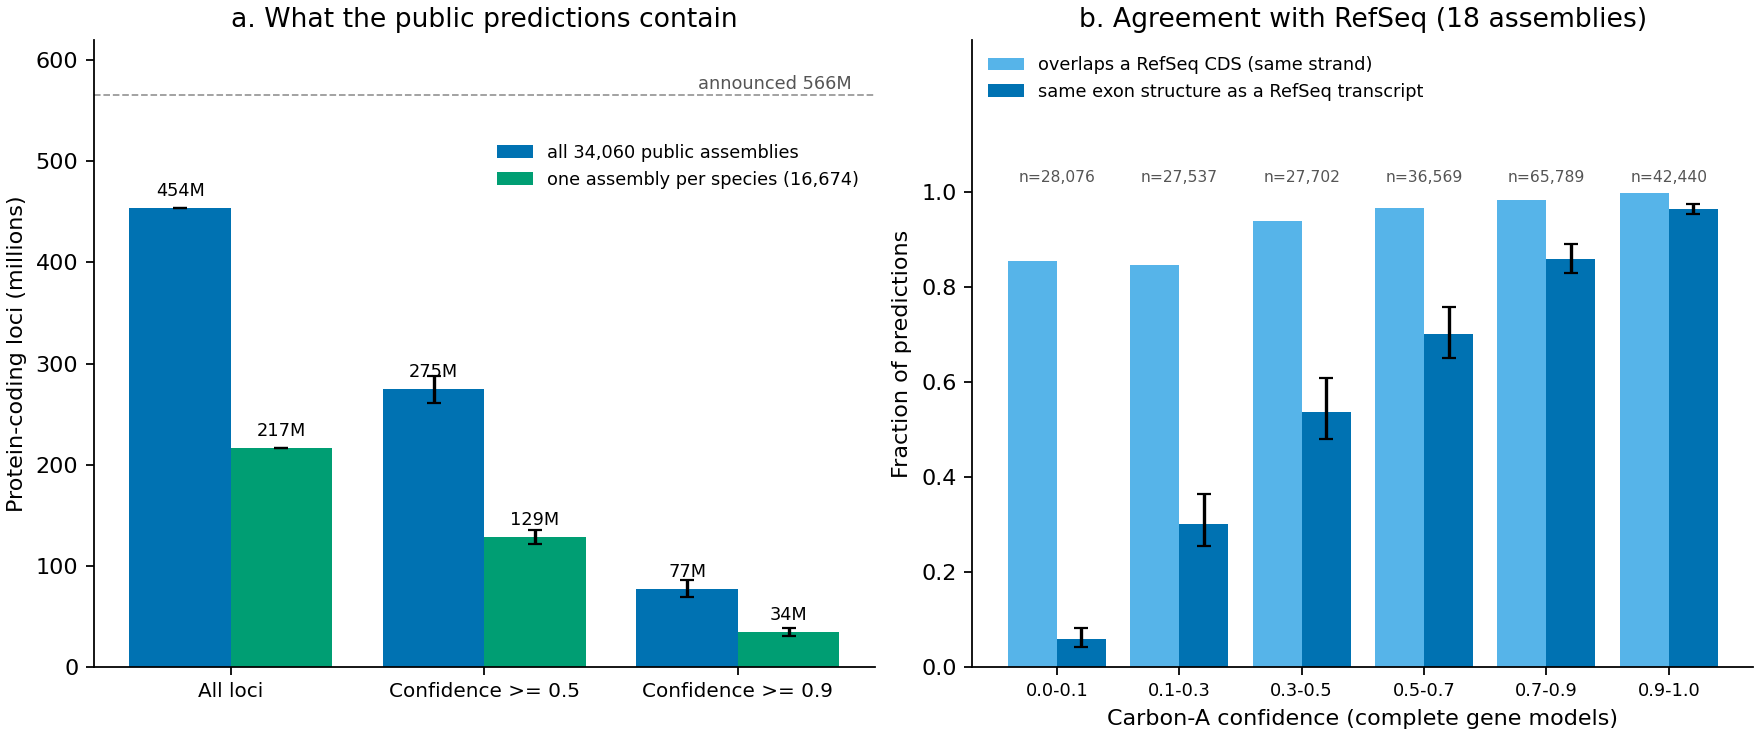
Figure 1. (a) Predicted loci in millions in the October 18 snapshot: all 34,060 assemblies in blue and one newest assembly per species, 16,674 species, in green. Confidence-filtered totals extrapolate from 120 sampled assemblies; bars are 95% intervals. The dashed line marks the announced 566 million. (b) Among structurally complete predictions in 18 identical-sequence RefSeq comparisons, light blue shows same-strand CDS overlap and dark blue exact exon-structure agreement. Error bars are assembly-bootstrap 95% intervals; n denotes predictions in each bin. RefSeq supplied training labels, making these optimistic assessments of independent accuracy.
Outputs are results/census.json, results/sample_assemblies.csv and results/refseq_agreement.csv.
Announcement versus retrieved snapshot
Available files totaled 34,060 assemblies and 453.79 million loci: 71% and 80% of the announced 48,167 and 566 million. Files were added daily from October 6 through 18. The announcement says approximately half the target genomes had been annotated and another batch was planned within weeks (1). Retrieved taxids numbered 17,390 rather than 22,617. This audit describes its October 18 inventory; release timing versus inventory-retrieval coverage was not resolved as the cause of the discrepancy. A future-batch plan alone does not explain missing entries from the advertised current release.
Multiple assemblies of a species
The 34,060 assemblies cover 16,674 species; 5,155 have more than one assembly. Humans contribute the most: 1,411 assemblies and 26.44 million loci in total. Median human assembly count was 19,159, close to the approximate 20,000 known protein-coding genes. Some large assemblies apparently containing multiple sequence sets reached 84,693 loci.
One newest assembly per species gave 216.72 million loci. Choosing the assembly nearest each species' median count gave 213.01 million; choosing the most processed bases gave 225.13 million. Under each rule, approximately half the all-assembly total consists of additional assemblies of the same species. These are not necessarily identical genes, because strains and individuals differ. They must not simply be summed to estimate species gene counts.
Completeness and confidence
Across divisions, 96–100% of sampled genes had complete coding structures. Postprocessing favors complete reading frames, so completeness alone cannot validate structure.
Confidence at least 0.5 covered 49–69% of predictions by division; at least 0.9 covered 9–31%. Extrapolated across all assemblies, totals were approximately 275 million at 0.5, with 95% interval 261–288 million, and 77 million at 0.9, with interval 69–86 million. One assembly per species gave approximately 129 million at 0.5, interval 121–136 million, and 34 million at 0.9. Eight of the 20 sampled mammalian assemblies were human, leaving potential bias when applying proportions to one-assembly-per-species totals.
Agreement with existing annotations
Table 1. RefSeq agreement across 18 assemblies; medians with ranges.
| Measure | Across 18 assemblies |
|---|---|
| Predictions with same-strand RefSeq CDS overlap | 95% (52–100%) |
| Predictions exactly matching a RefSeq transcript's exon structure | 67% (16–93%) |
| RefSeq genes overlapping predictions, recovery | 94% (0.3–100%) |
Most predictions overlapped known gene positions in many assemblies. Exact structural agreement increased from 6% below confidence 0.1 to 96% at confidence 0.9 or above; pooled below 0.5, agreement was approximately 30%. Same-strand overlap remained 86% even below 0.1. Many low-confidence predictions therefore locate a gene but disagree on exon boundaries. Confidence ranks predictions; it is not established as a calibrated probability of correctness.
Two comparisons had very few predictions: the green alga Monoraphidium neglectum, 86 predictions versus 16,755 RefSeq genes, and northern fulmar, 1,284 versus 15,106.
RefSeq supplied training targets, and annotations from these assemblies may themselves have been included in training. The historical RohitAI commentary describes the 42-genome technical benchmark as 28 training genomes plus 14 temporally held-out genomes (3); I do not present that secondary account as a newly verified primary split. This audit's agreement is closer to reference-annotation reproduction than validation in species without RefSeq, which account for much of the database.
Missing predictions do not establish absent genes
There were 2,976 zero-prediction assemblies, 8.7% of 34,060. Two patterns emerged.
In the 120-assembly sample, every shortest processed sequence was at least 8,000 bases, with exactly 8,000 in 25 assemblies. An upstream processing stage appears to exclude short sequences despite metadata showing a zero postprocessing minimum length. Fragmented genomes can therefore be only partly processed. Among 118 assemblies with comparable coverage information, 33 had less than 90% of the genome processed. Nine sampled zero-prediction assemblies had 0.1–40% processed.
Short sequences did not explain every case. Zero-prediction examples included a perch with 294 Mb and a wheat relative with 104 Mb of processed sequences at least 8 kb. Across 8,434 vertebrate assemblies, 1,429, or 17%, had fewer than 3,000 predictions, compared with typical vertebrate protein-coding counts around 15,000–25,000.
Among 22 assemblies with an identical RefSeq counterpart and 1–2,999 predictions, 20 were birds registered by BGI in May–June 2014, in the accession range GCA_000687205–GCA_000710305. Median contig N50 was 24 kb. A similarly fragmented galago assembly, N50 27 kb, recovered 96% of RefSeq genes. Fragmentation alone therefore did not explain the pattern; the cause of low yield in that group remains unidentified.
Comparative genomics and drug research can depend on whether a species lacks a gene or ortholog. Absence of a Carbon-A prediction cannot be read directly as biological absence.
Levels of evidence
Approximately half the snapshot total comes from additional assemblies of the same species. Approximately 60%, 275 million, were estimated above confidence 0.5, with many high-confidence predictions matching RefSeq structures in annotated species. Missing or low-yield assemblies contribute gaps that are not captured by counting predicted loci alone.
Providing confidence-ranked maps for thousands of poorly annotated species is valuable. But positional overlap, exact exon structure, transcription, translation and function remain different levels of support.
The release reports approximately 62% complete-CDS support from Iso-Seq in four species, near the corresponding RefSeq value (1). This supports transcripts and structures, not protein translation or biological function. Ribosome profiling and mass spectrometry are identified as further evidence needed for the latter. Requirements also depend on the claim: a candidate transcript and a newly functional protein should not be described as equally established.
Discussion
Carbon-A is particularly useful where RefSeq or Ensembl annotations are absent. In annotated species, however, approximately 30% exact structural agreement below confidence 0.5 cautions against treating every prediction as a resolved gene model.
Species counts depend on assembly redundancy and processed sequence coverage. Unpredicted regions need not lack genes, and a dated retrieved inventory can differ from the announced scale. These distinctions affect interpretation of candidate counts without dismissing the resource.
Data and code availability
The calculation code comprises seven scripts, 00_fetch_explorer_taxonomy.py through 06_census.py. They obtain inventories, 34,060 partial metadata requests, GFFs for 120 sampled and 18 comparison assemblies including RefSeq, several hundred MB in total, and NCBI assembly statistics, then generate results/ and Figure 1. Retrieval takes hours.
Storage updates can change inventories and samples when 01 is rerun. The October 18 list, data/cds_assemblies.csv, and metadata summary, data/metadata_heads.csv, are included; starting at 03 with those files reproduces the same sample.
python -m pip install -r requirements.txt
python 00_fetch_explorer_taxonomy.py
python 01_list_cds.py
python 02_fetch_metadata_heads.py
python 03_sample_gff.py
python 04_refseq_agreement.py
python 06_census.py
python 05_ncbi_assembly_stats.py
python 06_census.py
Limitations
Confidence totals extrapolate from 120 assemblies. RefSeq comparisons involve 18 assemblies and training-related annotations, not species without references. No independent completeness assessment such as BUSCO was performed. Structural agreement requires exact exon boundaries to any RefSeq transcript; positional overlap requires at least one same-strand base, while recovery uses gene spans including introns.
One-assembly selection changes totals from 213.01 to 225.13 million. The low-yield bird-group cause remains unresolved. Counts describe the checked snapshot rather than the continuously updated resource.
References
- Channing G, von Werra L, Gener Team. Carbon-A: Finding genes in known and unknown genomes. Hugging Face Biology Research; 2026 Oct 8. Announcement.
- HuggingFaceBio. GenBank annotations [Prediction database]. Public storage; Carbon Annotation Database Explorer. Snapshot accessed 2026 Oct 18.
- Ramachandran R. Carbon-A's 566 Million Gene Candidates: What the Evidence Supports. RohitAI; 2026 Oct 9. Commentary. Historical commentary cited in the original audit; full text was not newly retrieved for this revision.
- National Center for Biotechnology Information. RefSeq genome annotation, assembly reports and taxonomy [Data resources]. Genome files; NCBI Datasets API. Accessed 2026 Oct 18.