Capivasertib rest-day placement at the same weekly dose: a public PopPK simulation
Three equal-dose weekly schedules are compared with an independent implementation of published PK equations. Weekly AUC is nearly unchanged, while minima and cutoff-dependent low-concentration times differ. Conditional sensitivity simulations do not establish clinical equivalence or predict efficacy, toxicity, or recovery.
On this page
- Change treatment days while holding the weekly dose fixed
- What the public model represents
- Similar weekly AUC can conceal different concentration profiles
- Variability does not make AUC and minimum concentration interchangeable
- Which concentration defines “low”?
- Existing exposure–response analyses do not validate rearrangement
- Recovery during a break lies outside the PK model
- Limitations and reproduction
- References
Literature and public materials checked on October 12, 2026. The figures and tables below were calculated from published model equations and estimated parameters. This is neither a refit of patient-level data nor clinical validation of alternative schedules.
Capivasertib is an oral AKT inhibitor. In phase III CAPItello-291 for HR-positive, HER2-negative advanced breast cancer, it was combined with fulvestrant at 400 mg twice daily for four consecutive days followed by three days off (1, 2). An intermittent regimen raises questions about concentrations during the break as well as on treatment days.
What happens if the four treatment days are spread through the week without changing the weekly dose? Would equal weekly AUC make the arrangements equivalent?
In the public PopPK model, weekly AUC and maximum concentration barely changed, while minimum concentration changed substantially. Yet the ordering of schedules by time at low concentration reversed when the concentration cutoff changed. Neither weekly dose nor minimum concentration alone selects the arrangement of rest days.
Change treatment days while holding the weekly dose fixed
The quantity of interest is whether three schedules with equal weekly dose differ in weekly AUC, maximum and minimum concentrations, and time at low concentration, and whether those differences persist under model uncertainty.
The context of use is exploring candidate schedules and PK/PD observation windows for research on intermittent treatment. These calculations do not predict individual safety or efficacy probabilities or support changing treatment. They do not propose replacing the established regimen.
Define a week as Days 1–7. On each treatment day, administer 400 mg at its start and 12 hours later. All schedules therefore give eight doses, or 3,200 mg/week.
| Arrangement | Treatment days | Longest interdose interval | Role |
|---|---|---|---|
| Four consecutive days, three days off | Days 1, 2, 3, 4 | 84 h | Reference |
| Two two-day blocks | Days 1, 2, 5, 6 | 60 h | Hypothetical rearrangement |
| Four days, mainly alternating | Days 1, 3, 5, 7 | 36 h | Hypothetical rearrangement |
The mainly alternating schedule is not an exact 48-hour cycle: Day 7 and Day 1 of the next week are consecutive treatment days. The maximum interdose interval runs from the last dose to the next, rather than the number of rest days multiplied by 24 h. In the reference schedule, the interval from the evening of Day 4 to the morning of Day 8 is 84 h.
The principal comparison is week four, 504–672 h after treatment starts. Weeks one and eight were also checked. Initial drug amounts are zero; missed doses, additional interruptions and changes in concomitant drugs are absent.
What the public model represents
The 2024 paper (1) uses three distribution compartments with parallel first-order and zero-order absorption. The 2025 analysis (2) updates the same structure with additional data, including phase III data. I used Table 2 of the 2025 analysis for the main calculation and the 2024 estimates for sensitivity analysis.
The representative conditions are 67 kg, age 57, tablets, no strict overnight fast and no paclitaxel. The 67-kg value is the model's weight reference, distinct from the 65-kg median in the 2025 data. Fulvestrant PK and efficacy are not modeled.
| Parameter | Value | Unit or role |
|---|---|---|
| Initial CL/F | 59.6 | L/h |
| Central V/F | 49.0 | L |
| Peripheral V/F | 113, 103 | L |
| Intercompartmental Q/F | 2.52, 23.4 | L/h |
| First-order absorption rate | 0.441 | h⁻¹ |
| Logit of first-order absorption fraction | 1.6 | Dimensionless |
| First-order absorption lag | 0.287 | h |
| Zero-order absorption duration | 45.0 | h |
| Clearance-change coefficient \(I_{\max}\) | −1.87 | Dimensionless, log scale |
| Half-time of change \(T_{50}\) | 126 | h |
| Dose coefficient | −0.00213 | mg⁻¹ |
All parameters are apparent parameters; no separate absolute bioavailability is multiplied in. The first-order fraction is \(f_1=\operatorname{expit}(1.6)\), with the remainder assigned to zero-order absorption. First-order absorption begins after its lag; zero-order input begins at dosing and continues for 45 h. Inputs from successive doses overlap. The 45 h is an empirical input duration in this model, not a claim that food or tablets remain in the stomach that long.
Let \(A_c,A_{p1},A_{p2}\) be central and peripheral amounts and \(A_g\) the first-order absorption amount. Using apparent volumes and \(C=A_c/V_c\),
\[ \frac{dA_g}{dt}=-k_a A_g, \]
\[ \frac{dA_c}{dt}=k_a A_g+R_0(t)-CL(t)\frac{A_c}{V_c} -Q_1\left(\frac{A_c}{V_c}-\frac{A_{p1}}{V_{p1}}\right) -Q_2\left(\frac{A_c}{V_c}-\frac{A_{p2}}{V_{p2}}\right), \]
\[ \frac{dA_{pj}}{dt}=Q_j\left(\frac{A_c}{V_c}-\frac{A_{pj}}{V_{pj}}\right),\quad j=1,2. \]
The \(/F\) notation is omitted from the equations for brevity. Clearance changes as
\[ CL(t)=CL_0\left[1-\exp(I_{\max,i}) \frac{t^5}{T_{50}^5+t^5}\right], \]
\[ I_{\max,i}=I_{\max}\{1+(D-480)\theta_D\}\exp(\eta_I) \]
Scheduled dose \(D\) remains 400 mg in all conditions. The exponential applies to \(I_{\max,i}\), not to the entire time-dependent expression.
Time \(t\) runs from treatment initiation. It does not reset during a break, and clearance does not return to baseline when concentration falls. Enzyme recovery, blood-glucose recovery and persistence of intratumoral AKT inhibition are outside this PK model.
I independently implemented the public equations and Table 2 in Python. This does not establish complete equivalence to the original NONMEM execution or validate patient-specific predictions. Integration was split at dosing and absorption-end events. Checks covered mass balance, halving the step size, a separate adaptive solver and the weekly-dose/CL relationship under constant clearance.
Similar weekly AUC can conceal different concentration profiles
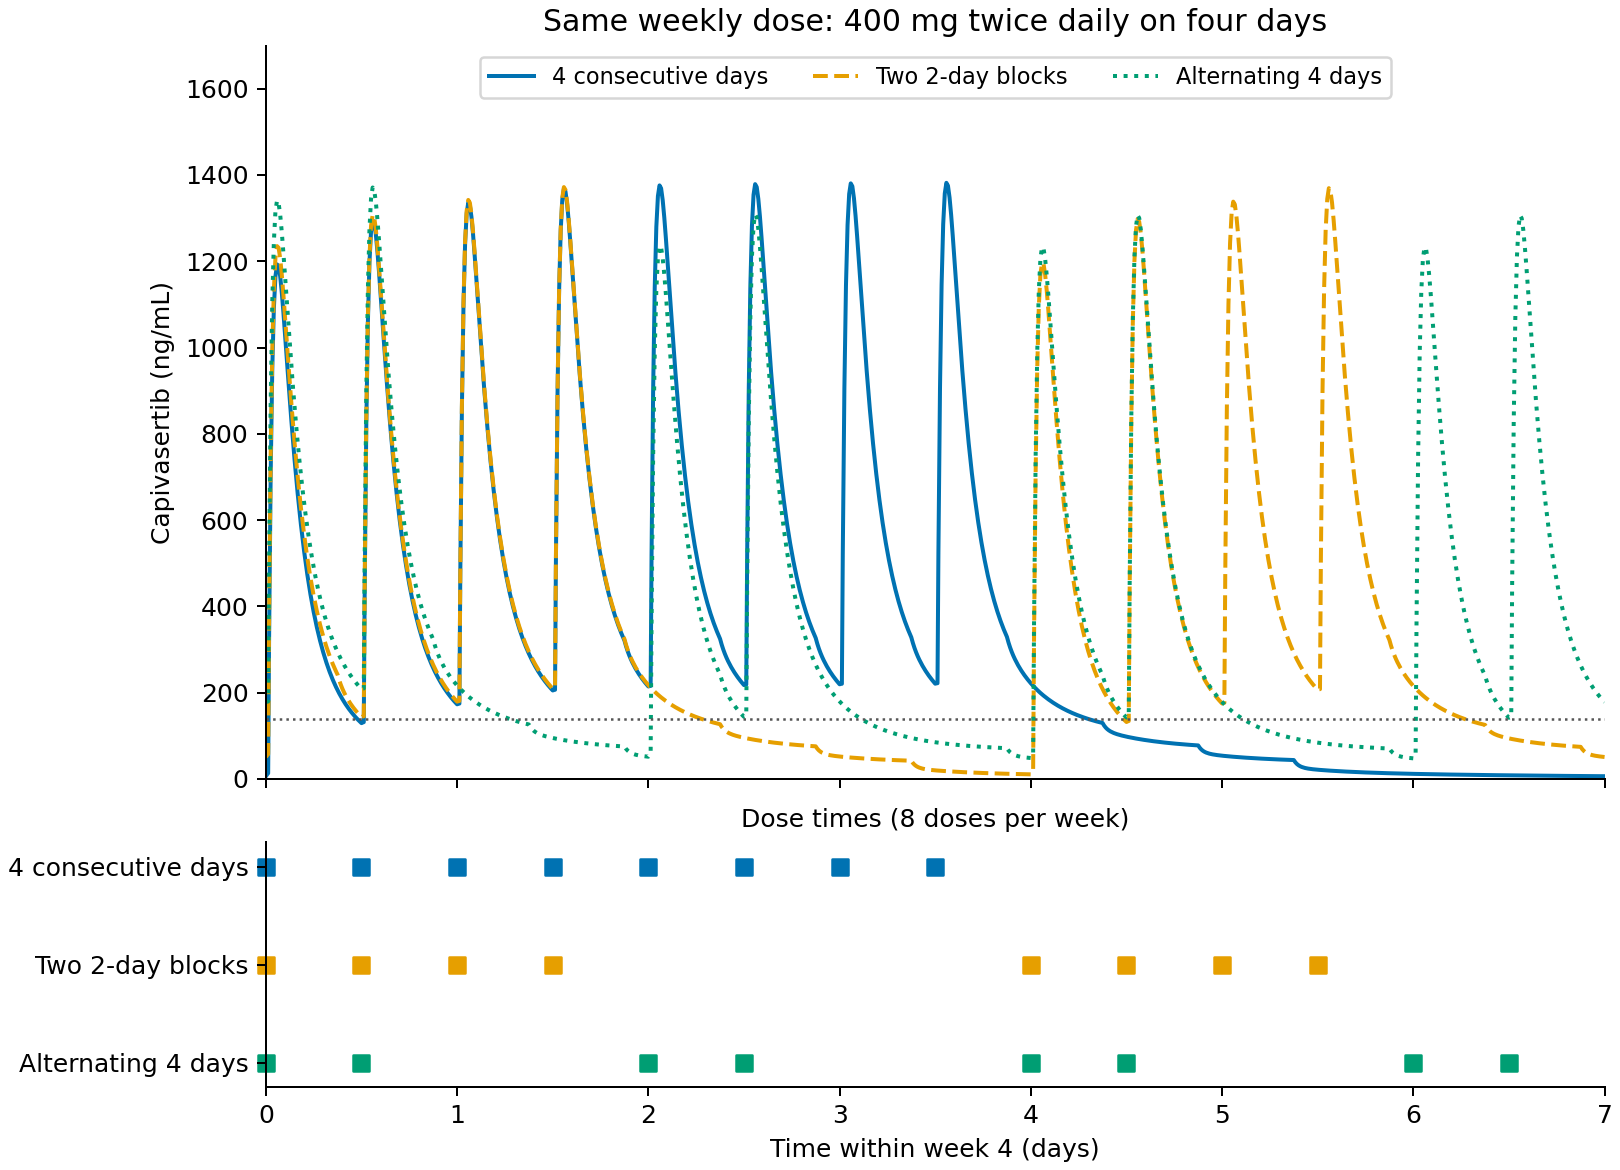
Figure 1. Week four under representative conditions. The upper panel shows plasma concentration and the lower panel dose times, all at 400 mg × eight doses/week. The dotted concentration is fixed at 10% of the representative peak under the four-consecutive-day schedule. It is a diagnostic cutoff, not a threshold for efficacy, toxicity or recovery.
| Arrangement | Weekly AUC (ng·h/mL) | Weekly maximum (ng/mL) | Weekly minimum (ng/mL) | Time below cutoff (h) |
|---|---|---|---|---|
| Four consecutive days, three off | 60,463 | 1,382 | 6.47 | 65.7 |
| Two two-day blocks | 60,463 | 1,372 | 10.78 | 59.9 |
| Four days, mainly alternating | 60,463 | 1,371 | 47.87 | 60.7 |
Values come from outputs/tables/typical.csv, generated by analysis/run_analysis.py. The cutoff is about 138.2 ng/mL. Minimum concentration is the minimum anywhere within the week, rather than a trough at a shared calendar time.
All schedules have weekly AUC of about 60,500 ng·h/mL and similar maxima. Spreading the days raises the minimum. However, the reduction in time below 10% of the peak is less dramatic than the fold increase in the minimum might suggest.
This is not because AUC ignores dose timing. In a linear constant-clearance model at periodic state, equal drug amounts at the beginning and end of a week imply, by mass balance,
\[ \mathrm{AUC}_{week}=\frac{\mathrm{Dose}_{week}}{CL} \]
Equal weekly AUC at equal weekly dose is therefore expected from that structure. Clearance changes little by week four here, approximating that relationship. It does not establish clinical equivalence of alternative schedules.
The model also includes 45-hour zero-order input. Absorption therefore need not stop when a rest day starts. Time without a dose and time without modeled drug input are different quantities.
Variability does not make AUC and minimum concentration interchangeable
I compared all three schedules within each of 256 virtual individuals, using fixed seed 20261012.
Only variability in CL, central volume and \(I_{\max}\) was included, using the CV entries in 2025 Table 2: 38.2%, 103% and 95.3%, respectively. These were converted to log standard deviations using \(\omega=\sqrt{\log(1+CV^2)}\). The three random effects were assumed independent.
Variability in absorption lag or fraction, correlations, weight and age distributions, residual error and fixed-effect estimation uncertainty were omitted. This is conditional sensitivity analysis for three selected parameters, not a reconstruction of the clinical population. I also calculated the alternative interpretation that reads the CV values directly as log standard deviations.
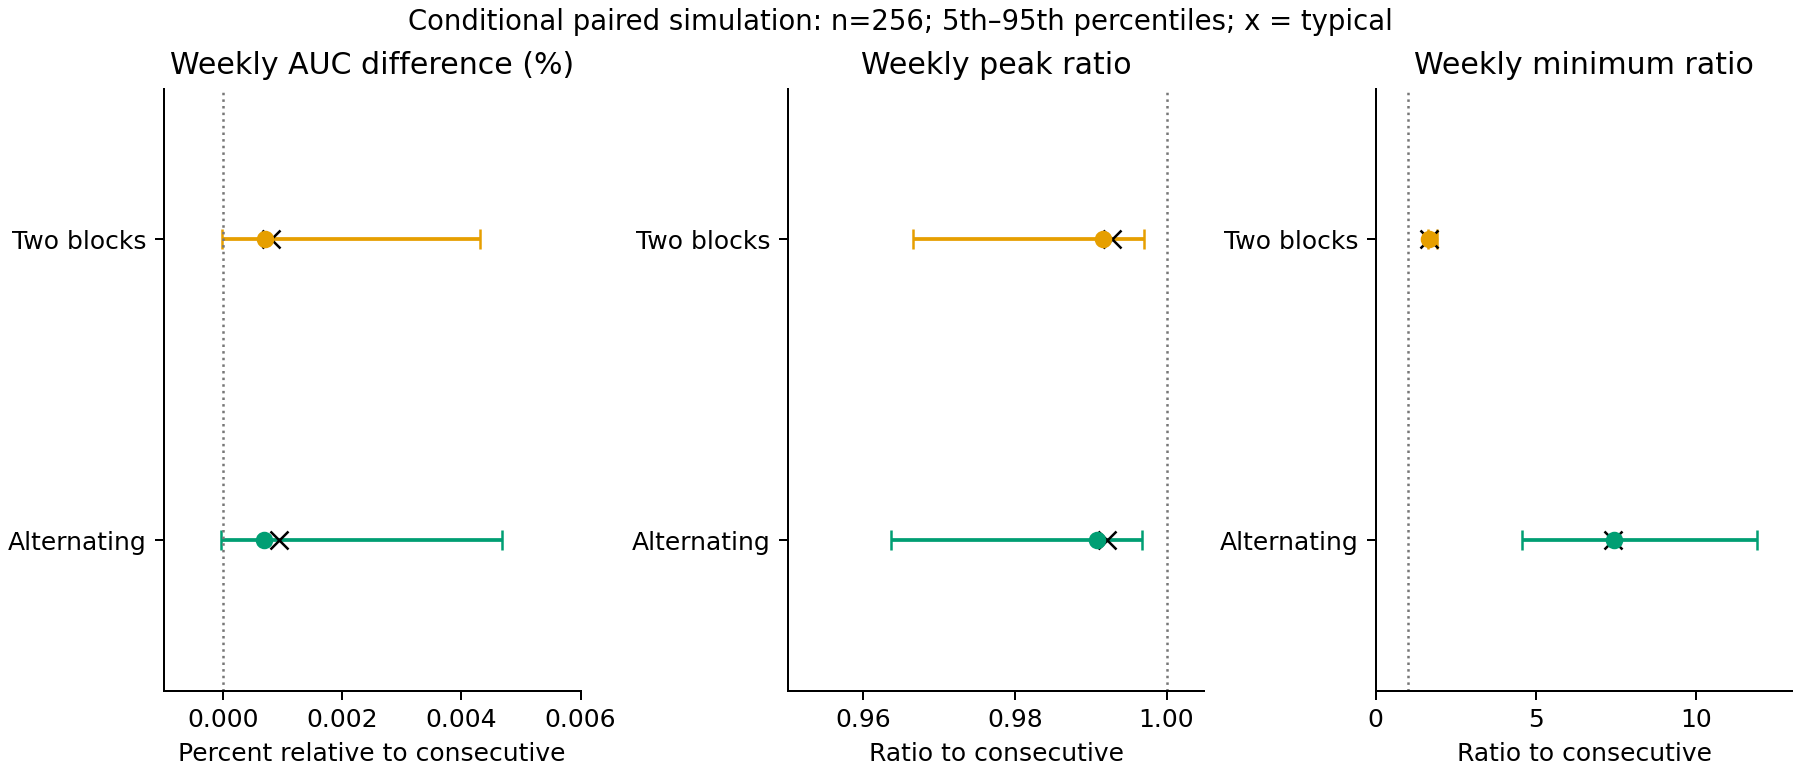
Figure 2. Paired comparisons against four consecutive treatment days. AUC is shown as percentage difference; maximum and minimum concentrations as ratios. Points are medians, lines the 5th–95th percentiles and crosses representative conditions. Horizontal units and ranges differ across panels. Lines are not confidence intervals. Tiny AUC differences should not be read as clinical differences.
| Arrangement | Weekly AUC ratio | Maximum ratio | Minimum ratio | Difference in low-concentration time (h) |
|---|---|---|---|---|
| Two two-day blocks | 1.00001 [1.00000, 1.00004] | 0.99 [0.97, 1.00] | 1.66 [1.63, 1.92] | -7.6 [-22.7, 3.7] |
| Four days, mainly alternating | 1.00001 [1.00000, 1.00005] | 0.99 [0.96, 1.00] | 7.42 [4.56, 11.88] | -6.1 [-42.4, 6.8] |
Brackets indicate 5th–95th percentiles of the conditional virtual distribution. Low-concentration time is a difference from reference, rather than a ratio. Output: outputs/tables/paired.csv.
AUC ratios cluster near one, while minimum-concentration ratios differ markedly. The ranges for differences in low-concentration time cross zero. Raising the minimum does not necessarily shorten low-concentration time in every virtual individual.
Which concentration defines “low”?
The 138.2 ng/mL cutoff is not a validated efficacy or safety boundary. To avoid conclusions tied to one arbitrary value, I varied it from 5% to 50% of the reference peak.
| Fraction of reference peak | Concentration (ng/mL) | Four consecutive days, three off | Two two-day blocks | Four days, mainly alternating |
|---|---|---|---|---|
| 5% | 69.1 | 50.9 | 30.1 | 9.5 |
| 10% | 138.2 | 65.7 | 59.9 | 60.7 |
| 20% | 276.3 | 95.4 | 99.0 | 100.8 |
Schedule columns give hours below the cutoff during week four. Output: outputs/tables/cutoffs.csv.
At 5%, spreading treatment days substantially shortens low-concentration time. At 20%, four consecutive days produce less time below the cutoff. A schedule that creates a sustained block of higher concentrations has a different concentration distribution from one that raises the minimum.
This reversal does not identify 20% as the correct boundary. It shows that without a pharmacologically justified boundary, shorter time at low concentration cannot itself identify a better schedule.
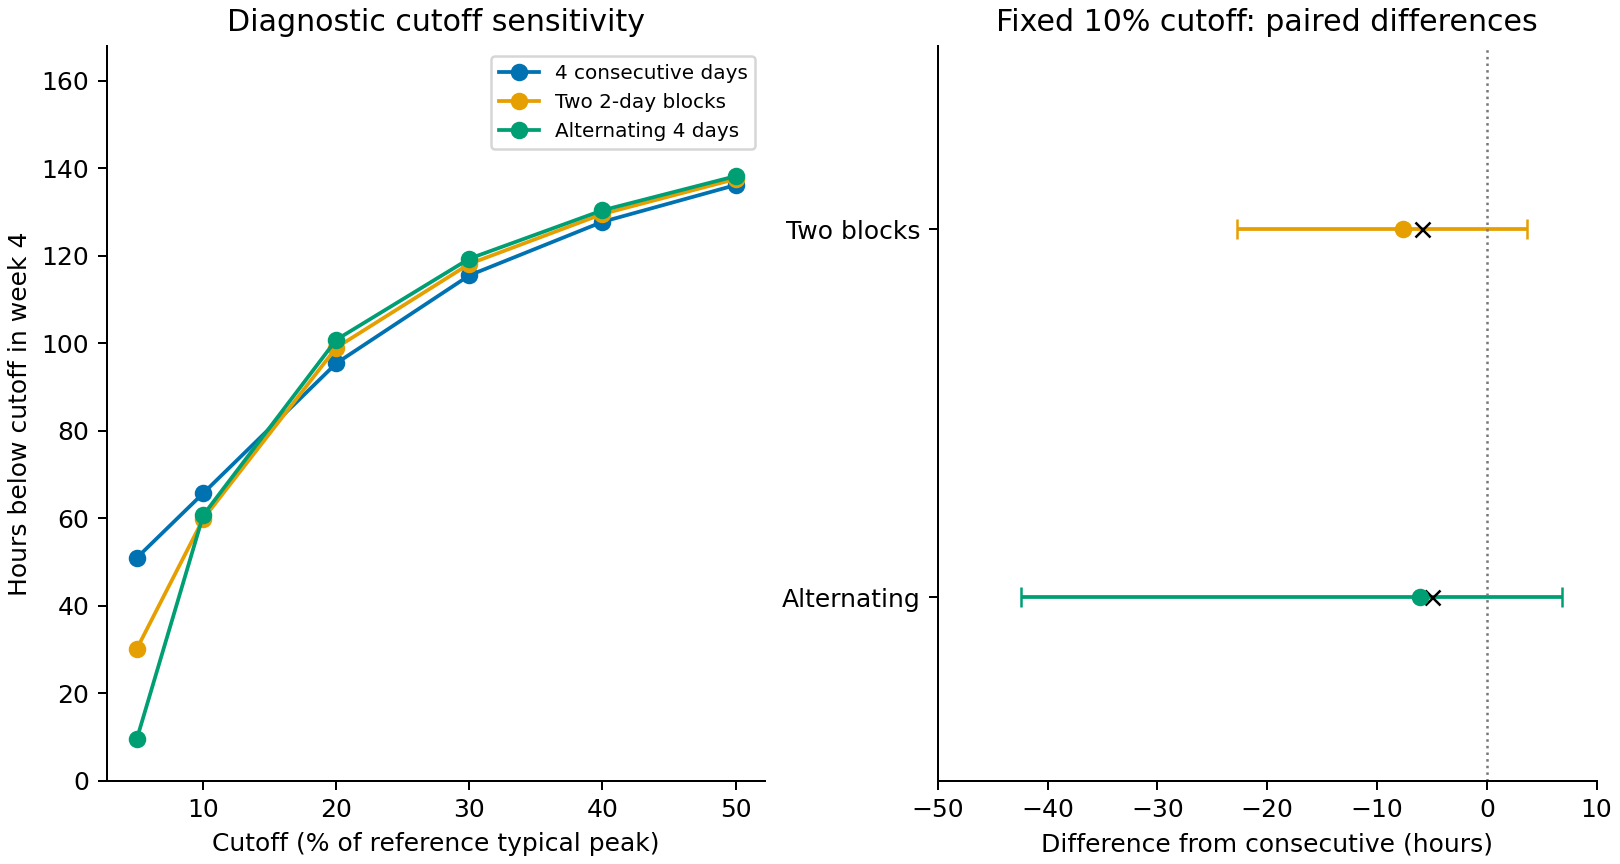
Figure 3. Left: low-concentration time as an arbitrary cutoff changes. Right: paired time differences in 256 conditional virtual individuals at a cutoff fixed to 10% of the representative peak. Points are medians, lines 5th–95th percentiles and crosses representative conditions. Orange indicates two two-day blocks and green the mainly alternating schedule. Lines are not confidence intervals.
Separately, I moved 13 parameters one at a time to their published bootstrap lower and upper bounds and examined exposure-ratio ranges across 26 conditions.
| Arrangement | Weekly AUC ratio range | Maximum ratio range | Minimum ratio range |
|---|---|---|---|
| Two two-day blocks | 1.000–1.000 | 0.990–0.995 | 1.439–1.943 |
| Four days, mainly alternating | 1.000–1.000 | 0.989–0.994 | 5.577–9.205 |
Weekly AUC differences remain small. Minimum-concentration differences remain but their magnitude depends on parameter values. Without the covariance of the original estimates, these ranges are not 95% confidence intervals.
Additional scenarios used the 2024 estimates, clearance fixed to its asymptote, a diagnostic condition without clearance change, fasting/formulation-dependent lag changes, week eight and the alternative CV interpretation (outputs/tables/scenarios.csv). Similar AUC with different minima persisted. Differences in low-concentration time depended on model conditions. The original time-dependent clearance equation contains no recovery after a break, so these calculations cannot assess whether such recovery occurs.
Existing exposure–response analyses do not validate rearrangement
The 2025 monotherapy exposure–safety analysis (3) associated weekly exposure with many evaluated adverse events and within-interval exposure with elevated blood glucose. One exposure metric did not explain every event. Its comparison of 480 mg on four days with 320 mg daily also changes weekly dose, unlike the equal-dose comparisons here.
The 2025 fulvestrant-combination analysis (2) detected no efficacy–exposure relationship, while detecting relationships for adverse events leading to dose reduction or interruption, Grade ≥3 events and Grade ≥2 diarrhea. Failure to detect an efficacy relationship does not establish preserved efficacy under another schedule.
Its principal exposure metrics were calculated over the 12-hour interval 252–264 h, on the last dosing day of week two. That differs from weekly AUC or the minimum anywhere within a week. I did not insert weekly AUC into those regressions or extrapolate safety probabilities to unevaluated arrangements.
As a scale check, I calculated the same 12-hour interval under reference conditions: representative AUC was about 7,481 ng·h/mL and maximum concentration about 1,378 ng/mL. The paper reports medians of 7,650 ng·h/mL and 1,460 ng/mL (2). This compares a fixed-covariate representative individual with population medians. No parameters were adjusted to erase the differences. It neither revalidates against observations nor establishes complete reproduction of the original model.
Recovery during a break lies outside the PK model
Equal weekly AUC did not imply equal minima or low-concentration durations. Peak differences were small in these rearrangements. This comparison therefore supplies no evidence of reduced toxicity associated with total exposure or peaks.
Whether a shorter low-concentration period is advantageous also remains unresolved. Recovery of glucose or symptoms and intratumoral AKT inhibition are absent from the model. Shortening that period could shorten a needed recovery window; a higher minimum cannot automatically be called an improvement.
Limitations and reproduction
No individual PK, PD or adverse-event time series were used. This is an independent implementation of equations and public estimates, with hypothetical schedules unvalidated against observations. Virtual-individual distributions are sensitivity analyses for selected parameters, rather than clinical predictive distributions. Concomitant drugs, interruptions, intratumoral concentrations, symptom recovery and practical adherence were not evaluated.
All numerical tables and figures were generated by analysis/run_analysis.py. The download includes code, package versions, the random seed and verification results. Original figures, patient data and supplement files are not reproduced; figures were drawn for this analysis.
References
- Fernandez-Teruel C, et al. Population Pharmacokinetics of Capivasertib in Patients with Advanced or Metastatic Solid Tumours. Clinical Pharmacokinetics. 2024;63:1191–1204. doi:10.1007/s40262-024-01407-x. Open full text.
- Fernandez Teruel C, et al. Population Pharmacokinetics and Exposure–Response Analyses for Capivasertib in Combination With Fulvestrant in Patients With Breast Cancer. Clinical and Translational Science. 2025;18:e70286. doi:10.1111/cts.70286. Open full text and supplements.
- Fernandez-Teruel C, et al. An exposure–safety analysis to support the dosage of the novel AKT inhibitor capivasertib. Cancer Chemotherapy and Pharmacology. 2025. doi:10.1007/s00280-025-04775-8. Open full text.
Calculation code, numerical tables and reproduction instructions
Cite this article
Kumakura, D. (2026). Capivasertib rest-day placement at the same weekly dose: a public PopPK simulation. daikikumakura.github.io. https://daikikumakura.github.io/writing/capivasertib-rest-schedule-en.html