Can an AI agent do a PK/PD analysis? Re-running a warfarin analysis with a public skill library
Four AI-agent warfarin PK/PD analyses expose hidden implementation and refitting failures despite similar headline results.
On this page
Experiments conducted October 18–19, 2026. Agent outputs, my checks and my interpretation are distinguished throughout.
Scientific “skills” for AI agents are multiplying. K-Dense's Scientific Agent Skills repository contains 177 skills, from genomics to clinical research, for tools including Claude Code and Codex (1). It includes pkpd-modeling for pharmacokinetics and pharmacodynamics.
The accompanying paper describes 163 skills and starts from a sensible concern: writing executable code is different from producing a defensible analysis (2). The paper itself does not report task-level evaluation.
I therefore gave AI agents the data and question from my previously published warfarin PK/PD analysis. There were two runs with the skill and two without, four in total. The reference was version 1.0 of my article, dated October 4, 2026. The experiment subsequently led me to add absorption lag in version 1.1 on October 19 and estimate the Hill coefficient in version 1.2 on October 20, as discussed below.
The four runs produced similar major estimates and answers, but concealed implementation and refitting errors appeared on inspection. Within-condition variation was substantial; two runs per condition cannot establish a skill effect. The record below separates reported results from problems found by reading code.
What the skill contains
As checked on October 12, 2026, the MIT-licensed pkpd-modeling skill contains SKILL.md, 14 reference documents and 10 Python scripts (1). Scripts cover noncompartmental analysis, individual compartment-model fitting, population PK data checks, dosing simulations, bioequivalence, drug interactions and therapeutic drug monitoring.
It does not itself implement population nonlinear mixed-effects estimation. Instructions direct the agent to engines such as NONMEM, Monolix or nlmixr2. The skill supplies procedures and cautions: establish units and conventions, distinguish convergence from identifiability, and check dataset structure.
Experimental design
- Agent: fresh Claude Code general-purpose subagents using
claude-opus-5-5. This is the same model family as the assistant used to prepare this article. - Conditions: skill present, S1 and S2; absent, N1 and N2. In skill runs I placed its directory in the workspace and instructed the agent to read
SKILL.mdfirst. I did not use the skill's normal activation mechanism. - Workspace: a fresh directory per run containing only the 515-row
warfarindataset from nlmixr2data (3). Because my analysis existed elsewhere on the same computer and online, agents were instructed not to read outside the workspace, search the web or install packages. These were instructions, not technically enforced restrictions. R 4.5.3, nlmixr2est 7.1.0, rxode2 5.1.8 and Python 3.12 were available. - Task: inspect data; construct population PK and PK/PD models; report estimates, uncertainty, diagnostics, comparisons and limits; answer whether a person's concentrations up to 24 hours improve prediction of prothrombin complex activity (PCA) after 24 hours relative to a population prediction. The common prompt is distributed.
- Scoring: criteria were set before the experiment using my analysis as a reference. Scoring was unblinded and performed by the reference analysis's authors, myself and my assistant. One analyst's analysis is a comparator, not ground truth.
Two runs per condition support description, not estimation of the skill's effect.
Three features were not controlled. First, both conditions likely inherited my general workspace rules, including avoiding leakage and taking numbers from executed outputs. No-skill agents therefore still had general analysis guidance. Second, subagents could not write report files; all returned their reports in final messages. Third, usage limits interrupted three runs, which were resumed with a fixed message included in the materials. Elapsed time and token use cannot be compared. Uninterrupted S2 took about 53 minutes, 177,000 tokens and 52 tool executions.
Results
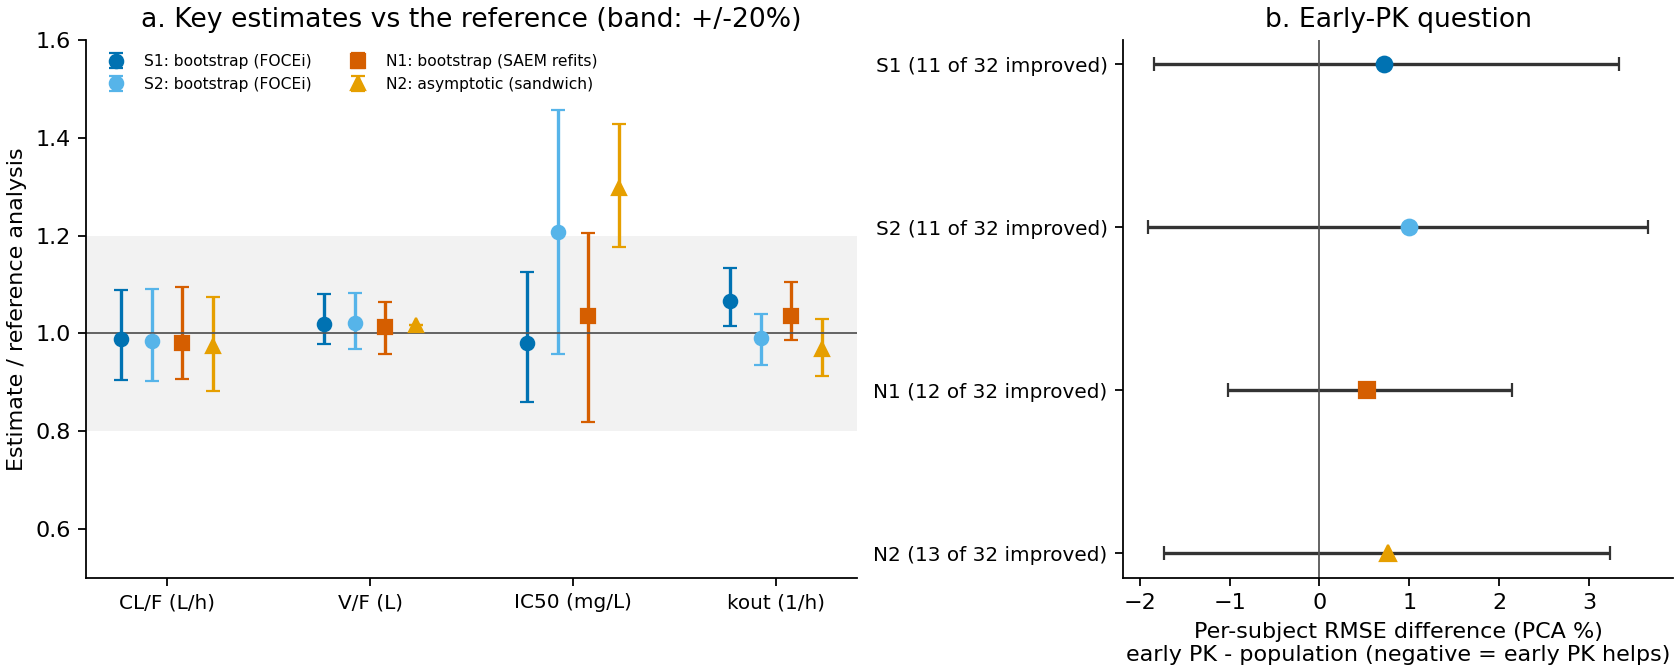
Figure 1. (a) Major estimates relative to my weight-adjusted reference: CL/F 0.136 L/h, V/F 7.92 L, IC50 1.15 mg/L and kout 0.0514 /h. Error bars are agent-reported 95% intervals of different types: FOCEi bootstrap for S1/S2, bootstrap refitted with SAEM for N1, and asymptotic intervals for N2. My reference fit had optimization warnings and no interval. N2's V/F is the sum V1+Vp from its two-compartment model, without an interval. The gray band marks ±20%. (b) Mean subject-level RMSE differences, in PCA percentage points, between concentration-informed and population predictions, with 95% intervals. Negative values favor concentration information.
Outputs: results/comparison.csv and results/rubric.csv.
FOCEi and SAEM are nonlinear mixed-effects estimation methods. The objective function value (OFV) measures lack of fit. For nested models fitted to identical data under regular conditions, an improvement of about 3.84 is often used when adding one parameter. That approximation does not transfer directly to cases such as a variance component on a zero boundary. A turnover model represents delayed action by inhibition of clotting-factor production while factors disappear at rate kout.
Data inspection
All runs identified the 32-person, 515-row structure; missing baseline PCA for IDs 1 and 7; four zero concentrations at 0.5 hours; four pairs of different concentrations at identical times for ID 9; the inseparability of dose and weight under 1.5 mg/kg dosing; and PCA's ceiling at 100%. All recognized that only 13 participants had concentrations before 24 hours, while the other 19 had only the 24-hour measurement in that window.
Treatment of zeros differed. S2 retained them and checked exclusion in sensitivity analysis; the other three excluded them. S1 attempted a censored-data sensitivity fit, but estimation did not move, leaving it inconclusive.
Only S1 and S2 explicitly described CL/F and V/F as apparent parameters because dosing was oral. The skill requests that distinction, but two versus two observations cannot distinguish its effect from chance.
PK models
All runs used nlmixr2 population PK with weight adjustment and selected absorption lag with interindividual variability. My version 1.0 lacked lag.
Within S1 and N1, excluding zero concentrations, lag improved OFV by about 80 and its variability by another 60. In S2, retaining zeros, lag and its variability improved OFV by about 200. However, warfarin is a widely used nlmixr2 example, and the lag-plus-turnover structure resembles published examples. Discovery cannot be separated from recall of training knowledge.
One error was absent from the agent's report. S2 labeled a comparison model “lag time, weight adjusted”, yet its OFV was 393.49, almost identical to my no-lag model's 393.52. The code merely defined tlag without attaching lag to the model. rxode2's linCmt() ignored it. My check confirmed exactly identical concentrations with and without the variable, although S2 reported an estimate and standard error for it. Its final model used the correct specification, so final estimates were unaffected.
CL/F estimates were 0.132–0.134 L/h, 1–3% below my 0.136 L/h. V/F estimates were 8.02–8.09 L, 1–2% above my 7.92 L; N2's value sums two compartment volumes.
PK/PD models
All runs captured PCA declining later than concentration and chose turnover models. Three compared direct-effect models; N1 compared only an effect-compartment alternative.
The main difference was whether to estimate the inhibition-curve Hill coefficient. Estimating it improved OFV by 7.5–17.9 in three runs. S2 and N2 selected estimated slopes of 1.20 and 1.28; their IC50 values, 1.39 and 1.49 mg/L, were 21–30% above my 1.15. S1 fixed the slope at one because IC50 became poorly determined, explicitly disclosing that this was a post-result choice. The data supported a steeper curve than slope one, prompting my later revision.
All kout estimates, 0.050–0.055 /h, resembled my 0.0514 /h.
Answering the prediction question
All runs used subject-held-out cross-validation: leave-one-out in three, eight-fold in one. They refitted without the held-out participant, estimated that person's PK by MAP using concentrations only through 24 hours, and compared PCA prediction errors after 24 hours.
All answered that there was no evidence of improvement. Mean subject RMSE differences were +0.52 to +0.99 PCA percentage points, where positive means worse, with all 95% intervals crossing zero. Eleven to 13 of 32 participants improved. In the 13 with pre-24-hour concentrations, differences were +0.17 to +1.02, with wide intervals extending roughly 3–7 points on either side; N2 supplied no interval. Precision is insufficient to exclude improvement in that subgroup. My analysis, using a different prediction-error metric, reached the same overall direction.
The population comparator differed from mine. Agents used a model-estimated baseline rather than the person's observed baseline PCA; my analysis normalized by baseline. An additional S2 comparison improved slightly when baseline PCA was added.
My code checks found the 24-hour cutoff correctly respected in all runs. Refitting was less reliable. In two of S1's eight folds, PK estimates stayed at their initial values, rounded estimates from the full dataset. Predictions therefore retained information from data including held-out participants. S2's leave-one-out FOCEi fits also started from full-data estimates, without checking movement. N2 tested this approach, found 26 of 32 fits unchanged and supplemented it with SAEM. Although unlikely to reverse the overall direction, these failures mean part of the claimed cross-validation was not valid.
Weaknesses found in the outputs
Most scoring criteria were met in all runs. Numerical instability and the effort required to detect it stood out.
- Stationary refits: all encountered FOCEi fits stuck at initial values. Many tried multiple starts, SAEM or changed optimizers, but some failures were missed.
- Intervals: all recognized implausibly narrow covariance-based intervals, including relative standard errors of 0.02–0.04%. S1, S2 and N1 primarily used bootstrap intervals. N2 noted the issue in intermediate fits but reported asymptotic intervals for its final model.
- Model specification: S1 and N1 found that some observations were assigned to the wrong compartment when the first row preceded dosing in a lag model. They worked around it by rearranging data or rewriting the analytical solution. Software error and input-specification error were not separated.
- Unreproducible values: S1 retained two numbers from diagnostic scripts it had deleted, disclosing this in its report.
- Scope: S1 did not clearly state that a single-dose PCA analysis cannot guide INR or dosing decisions.
Agents disclosed some issues, including S1's deleted scripts, an S2 transit-compartment implementation error and N1's estimation-method differences. Incorrect lag specification and failed cross-validation refits emerged only from code and output inspection.
Refitting failures hidden by a convincing report
Within this experiment, agents were useful for analysis drafts and an additional perspective, while model choices and output checks still required human judgment.
They completed workflows from data checks through cross-validation and challenged simplifications in my analysis, including absent lag and fixed slope. Model choices moved some estimates by 20–30%, and polished reports omitted consequential errors. Deciding whether a choice answers the question remains the analyst's responsibility.
I revised my own analysis to version 1.1, adding lag and its variability; PK OFV fell by about 198. During that review, I found the same failure in my version 1.0: 20 of 67 PK refits for cross-validation and bootstrap had not moved from full-data estimates. Version 1.1 used starting values different from the full-data estimates and recorded whether every refit moved. Version 1.2 estimated a Hill slope of 1.28 and improved OFV by 17.3, matching N2's slope. Held-out prediction did not improve: RMSE was 0.0827 versus 0.0807 with slope one. Better fit did not mean better prediction. The answer's direction was unchanged across versions. These weaknesses apply to human analyses too.
The skill's effect remains unresolved. Even within a condition, runs differed on estimating the Hill slope. This task required a population PK estimation engine, so many bundled skill scripts were unused. Tasks such as noncompartmental analysis or bioequivalence, where scripts apply directly, might behave differently.
Regulatory analyses additionally require a prespecified plan, versioning and audit trails, independent human checks, control over data sent to external AI services, and managed software environments. FDA's January 2025 draft guidance and EMA's 2024 reflection paper frame credibility around context of use and model influence (4, 5). ICH M15, finalized at Step 4 in January 2026, addresses documentation and evaluation in model-informed drug development (6). Agent-written analyses remain subject to those principles.
Limitations
The experiment has substantial limits. Two runs per condition do not estimate skill effects. Only one model family, shared with my assistant, was tested. Workspace restrictions were instructional, and the familiar teaching dataset may have appeared in training. Scoring was unblinded. Planned reruns of all agent scripts, taking several hours overall, were not performed; I instead checked report numbers against outputs, the 24-hour cutoff and major model specifications. The inspection can miss errors. Runs were concurrent on one computer; N1 reported seeing other R process names while saying it did not inspect their contents.
My version 1.0 reference itself had optimization warnings, and agents sometimes selected better-fitting structures. Revised version 1.2 estimates without weight adjustment were CL/F 0.134 L/h, V/F 8.03 L, IC50 1.46 mg/L, Hill slope 1.28 and kout 0.0495 /h; Figure 1 does not use them as its reference. One public single-dose dataset does not measure general PK/PD competence.
Data and code availability
The comparison script reads distributed summary tables in agent_tables/ and creates results/comparison.csv and Figure 1. Materials also include prompts and resumption text in prompts/, prespecified criteria in analysis-plan.md, scores in results/rubric.csv, and the lag-specification check check_lincmt_tlag.R. Remaining agent workspaces, including individual predictions and model files, are withheld under the original analysis's policy against redistributing source data. Data are available from nlmixr2data.
References
- K-Dense. Scientific Agent Skills: pkpd-modeling [source code]. Commit a1043ef, 2026 Oct 12. MIT License. Repository.
- Kassis T, Agarwal V, He Y, Patel D, Brueckner AM. Scientific Agent Skills: A Library of Procedural Knowledge for Research Agents. arXiv [preprint]. 2026;2609.00065. doi:10.48550/arXiv.2609.00065.
- Fidler M, Wang W. nlmixr2data: nonlinear mixed effects models in population PK/PD, data [software]. Version 2.0.10. CRAN. doi:10.32614/CRAN.package.nlmixr2data.
- US Food and Drug Administration. Considerations for the use of artificial intelligence to support regulatory decision-making for drug and biological products. Draft guidance. 2025 Jan. FDA guidance.
- European Medicines Agency. Reflection paper on the use of artificial intelligence in the medicinal product lifecycle. EMA/CHMP/CVMP/83833/2023. 2024. EMA reflection paper.
- International Council for Harmonisation. M15: general principles for model-informed drug development. Step 4, 2026 Jan 29. Guideline.