Can initial mercaptopurine records predict subsequent neutrophil counts?
Public dosing and ANC records test baseline updating against simple forecasts, without establishing dose-optimization benefit.
On this page
- Introduction
- Defining a 28-day forecast
- Dosing and ANC records rather than concentrations
- Patient and temporal separation
- Fixed and estimated components
- Whether future dosing is known changes the question
- Forecast results
- Gate before dose-rule comparison
- Discussion
- Data and code availability
- References
Introduction
Literature checked on October 18, 2026. I reanalyzed public dosing histories and measured absolute neutrophil counts, ANC, during childhood acute lymphoblastic leukemia, ALL, maintenance. There are no drug-concentration observations, so this is prediction using a fixed drug-input model and estimated population PD, not new PK estimation.
Maintenance combines 6-mercaptopurine, 6-MP, and methotrexate, MTX, with dose adjustment according to blood counts. Delayed marrow suppression means today's dose and ANC need not identify the next several weeks (1, 2). Does updating a model from early records improve future ANC prediction?
This model did not establish added value from updating baseline ANC, and dose-rule optimization was not undertaken. Among 31 evaluation patients, MAE under continuation of the last recorded dose was 0.727 G/L with individual updating, 0.791 with last ANC and 0.711 with population parameters alone. The interval for the updating-versus-last-ANC difference crossed zero.
Defining a 28-day forecast
Table 1. Question and intended use.
| Item | Definition |
|---|---|
| Question | Does updating from the first 84 days improve ANC prediction over the next 28 days relative to last ANC or population-only prediction? |
| Intended use | Assess prediction and uncertainty before model-assisted dosing research, not clinical adjustment |
| Endpoint | Mean patient-level MAE, weighting patients equally; patient-bootstrap 95% intervals for differences |
Prediction must justify the basis for a dosing comparison. More elaborate simulation cannot compensate for inadequate predictions.
Dosing and ANC records rather than concentrations
Jost and colleagues provide supplementary records for 116 patients (1). Data_Sheet_2.CSV contains measured DV alongside model IPRED. I excluded IPRED and did not use the original individual parameter estimates as priors, initial values or evaluation truth.
Table 2. Input audit.
| Item | Count or treatment |
|---|---|
| Patients | 116 |
| Events | 55,305 |
| Positive-dose events | 49,408 |
| Measured ANC | 5,897 |
| Missing cells / exact duplicate rows | 0 / 0 |
| Zero ANC observations | Two, both after day 112 in evaluation patients, outside training, calibration and primary scoring; excluded from log-model formatting without inventing a detection limit |
Days without a dose event have recorded input zero, which cannot distinguish actual interruption, missing records or adherence. Prescribed and swallowed doses may differ. MTX coadministration also prevents interpreting sensitivity as pure 6-MP sensitivity; TPMT and NUDT15 genotypes are not inferred.
The original analysis excluded 1,150 ANC observations within two weeks of CRP >5 mg/L, fitting 4,747 observations. This CSV has no CRP or exclusion flag, so that exclusion cannot be reproduced. The reanalysis starts from the full public CSV and can retain infection-related variation; errors cannot be attributed solely to updating performance.
Patient and temporal separation
A fixed seed split patients into 60 training, 20 calibration and 36 evaluation patients. Training uses records through day 168; evaluation-patient updates use only days 0–84. One training patient had fewer than four positive ANCs through day 168, leaving 59 for estimation. Updating requires at least four positive ANCs through day 84 and evaluation at least one positive ANC after day 84 through day 112. Eligible calibration and evaluation counts were 17 and 31.
This is not external validation. The fixed structure originated from the same 116-patient research dataset. What is newly separated is this analysis's estimation, updating and scoring.
Fixed and estimated components
The original three-compartment drug input uses mg and days, with 0.22 times dose entering the absorption compartment (1):
\[ \dot X_g=-31.2X_g,\qquad \dot X_c=31.2X_g-12.72X_c \]
\[ \dot E=0.019\times9.9216X_c-k_E(BSA)E \]
E is a fixed-model output corresponding to 6-TGN, not measured intracellular concentration. I used \(k_E=0.219(BSA/1\,\mathrm{m^2})^{1.16}\) from the day-unit original Table 2. Equation 2 instead gives 0.00914, approximately 24-fold different. Multiplying 0.00914 by 24 gives 0.21936, consistent with rounding to 0.219 when converting an hourly coefficient to a daily coefficient. Table 2 explicitly labels its clearance coefficient L/day and the other rates day⁻¹, but Equation 2 gives no time unit. This is consistent with an unconverted hourly value in Equation 2; it is not evidence sufficient to establish the authors’ intended implementation. The calculation therefore remains conditional on the day-unit Table 2. CL, V and F are not estimated from concentrations; BSA is fixed to each patient's first recorded value.
The proliferating compartment P, three maturation compartments and circulating ANC N obey:
\[ \dot P=k_{tr}P\left[(1-sE)\left(\frac{B}{N}\right)^\gamma-1\right] \]
\[ \dot T_1=k_{tr}(P-T_1),\quad \dot T_2=k_{tr}(T_1-T_2),\quad \dot T_3=k_{tr}(T_2-T_3) \]
\[ \dot N=k_{tr}T_3-2.3765N \]
Initial drug amounts are zero, \(N(0)=B\), and \(P(0)=T_1(0)=T_2(0)=T_3(0)=2.3765B/k_{tr}\). This assumes model equilibrium rather than measuring initial marrow state.
Population estimation covers B, sensitivity s, maturation rate and feedback exponent. An initial B-and-s random-effect model put sensitivity log SD at its upper bound 1.5. Before examining calibration or evaluation results, I removed sensitivity variability and updated only B:
\[ \log B_i=\log B_{pop}+\eta_{B,i},\qquad \eta_{B,i}\sim N(0,\omega_B^2),\quad s_i=s_{pop} \]
Observation error is log-normal without explicit serial correlation. Patient bootstrapping quantifies scoring uncertainty and does not repair the residual model. Marginal likelihood uses 17-point Gauss–Hermite quadrature, checked at 25 points. Individual updating is baseline-ANC MAP with the fitted population distribution as prior and no post-day-84 ANC. Two optimization starts, integration steps and information boundaries were checked.
Table 3. Population estimates.
| Parameter | Value | Meaning |
|---|---|---|
| baseline | 1.661 | G/L, model baseline ANC |
| slope | 0.06157 | Inverse scale of modeled E, not measured 6-TGN sensitivity |
| ktr | 0.1398 | day⁻¹ |
| gamma | 1.2 | Dimensionless |
| omega_baseline | 0.2792 | SD of log B |
| sigma_log | 0.4946 | Log-residual SD |
No parameter confidence intervals were calculated. Random-effect SD is not estimation SE. Gamma reached its upper bound 1.2 even at the best start; another start gave different sensitivity–feedback combinations. Optimization termination does not establish parameter identification.
Whether future dosing is known changes the question
Table 4. Future-input conditions.
| Condition | Post-day-84 dosing | Interpretation |
|---|---|---|
| Continue last dose | Last positive dose through day 84 given daily thereafter | No-change scenario, not knowledge of actual future prescribing |
| Recorded future doses | Actual recorded days 84–112 | Retrospective conditional prediction, not prospective forecasting |
Dose changes may respond to blood counts, so future histories can encode treatment actions prompted by outcomes. Lower error with those histories cannot be assumed prospectively. Predictions are last ANC, population-only and individual-updated.
Among 31 patients, future records differed from the continuation scenario in 24 and matched in seven. For changed histories, scenario forecasts are compared against outcomes after different treatment. MAE therefore validates neither the counterfactual ANC under continued dose nor an entire prospective dosing system.
Forecast results
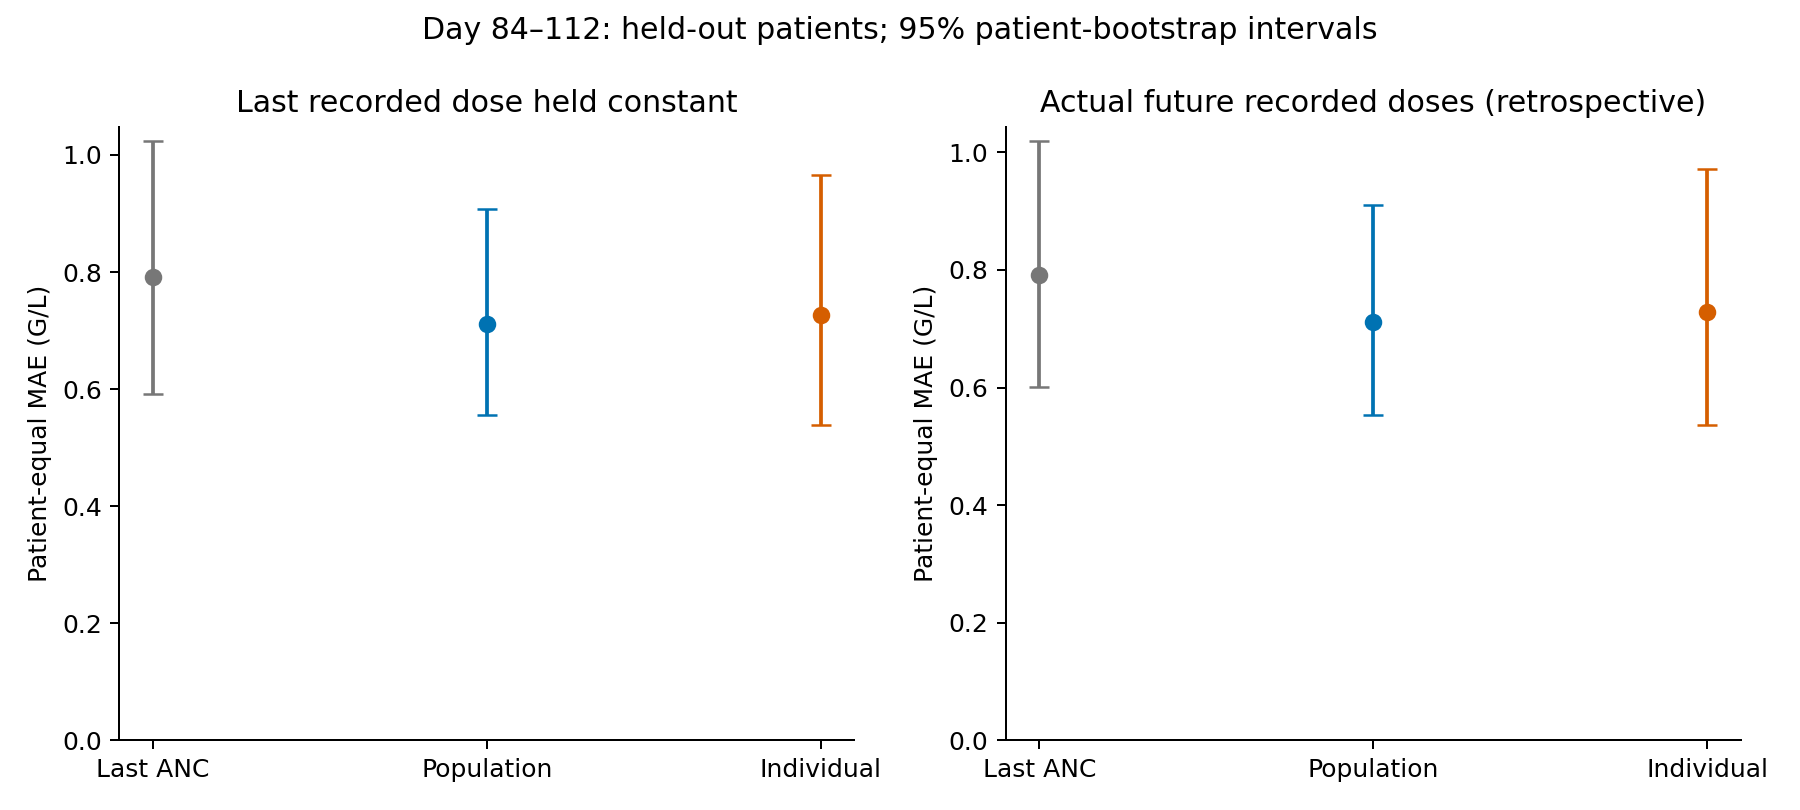
Figure 1. Patient-averaged MAE; lines are patient-bootstrap 95% intervals.
Table 5. Forecast errors and empirical bands.
| Input | Prediction | MAE G/L | RMSE G/L | 90% band coverage | Mean width G/L |
|---|---|---|---|---|---|
| Continue last dose | Last ANC | 0.791 | 1.192 | 89.8% | 4.821 |
| Continue last dose | Population | 0.711 | 1.086 | 85.1% | 2.846 |
| Continue last dose | MAP | 0.727 | 1.161 | 86.2% | 3.278 |
| Future records | Last ANC | 0.791 | 1.192 | 89.8% | 4.821 |
| Future records | Population | 0.711 | 1.087 | 85.1% | 2.849 |
| Future records | MAP | 0.728 | 1.162 | 86.2% | 3.281 |
Updating minus last-ANC MAE was −0.065 G/L, 95% interval −0.226 to 0.100, under continuation; and −0.063, interval −0.217 to 0.115, with future records. Negative differences favor updating. Intervals crossed zero, and updating did not beat population-only prediction. This establishes neither added value nor equivalence, restricted to this model, 31 patients, day-84 origin and 28-day horizon.
Table 6. Exploratory continuation-scenario strata. MAE in G/L.
| Subsequent recorded dosing | Patients | Last ANC | Population | Updating |
|---|---|---|---|---|
| Unchanged | 7 | 0.532 | 0.565 | 0.440 |
| Changed | 24 | 0.867 | 0.753 | 0.810 |
The seven unchanged patients are few, and dose-change status can relate to condition and clinical judgment. This is not a causal benefit of updating or a dosing-effect comparison. Each patient's errors were averaged before aggregation; 2,000 patient resamples supplied intervals, without treating repeated observations as independent patients.
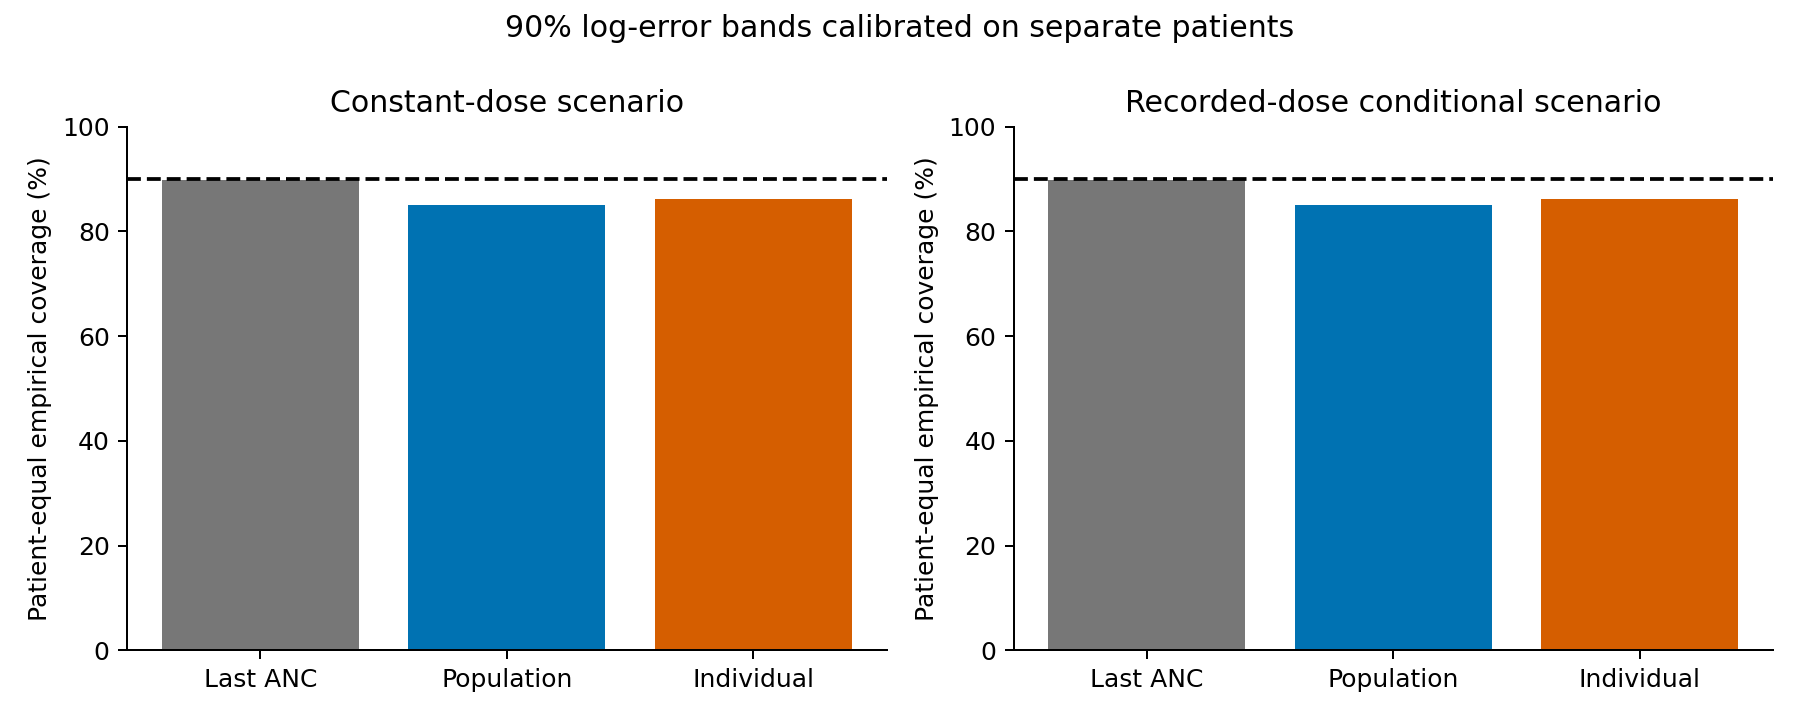
Figure 2. Coverage of empirical bands from separate calibration patients.
Bands use the 90th percentile of absolute log error in calibration patients, not full Bayesian parameter propagation. Calibration is observation-weighted whereas coverage summaries weight patients equally; 90% coverage is not guaranteed.
Halving integration steps from 0.25 to 0.125 day changed predictions by at most 0.000246 G/L. Changing future inputs left pre-day-84 MAP unchanged; 96 MAP optimizations met termination criteria. At fixed coefficients, increasing quadrature from 17 to 25 points changed negative log likelihood by 0.484. These check numerics and information boundaries, not clinical validity.
An exploratory stress condition divided metabolite elimination and sensitivity by 24 while holding other coefficients and updates fixed. MAE was 0.739 G/L under either future-input condition. This is not a comparison of independently refitted models or adjudication of the original coefficient discrepancy. Equal steady-state scale need not preserve response delay.
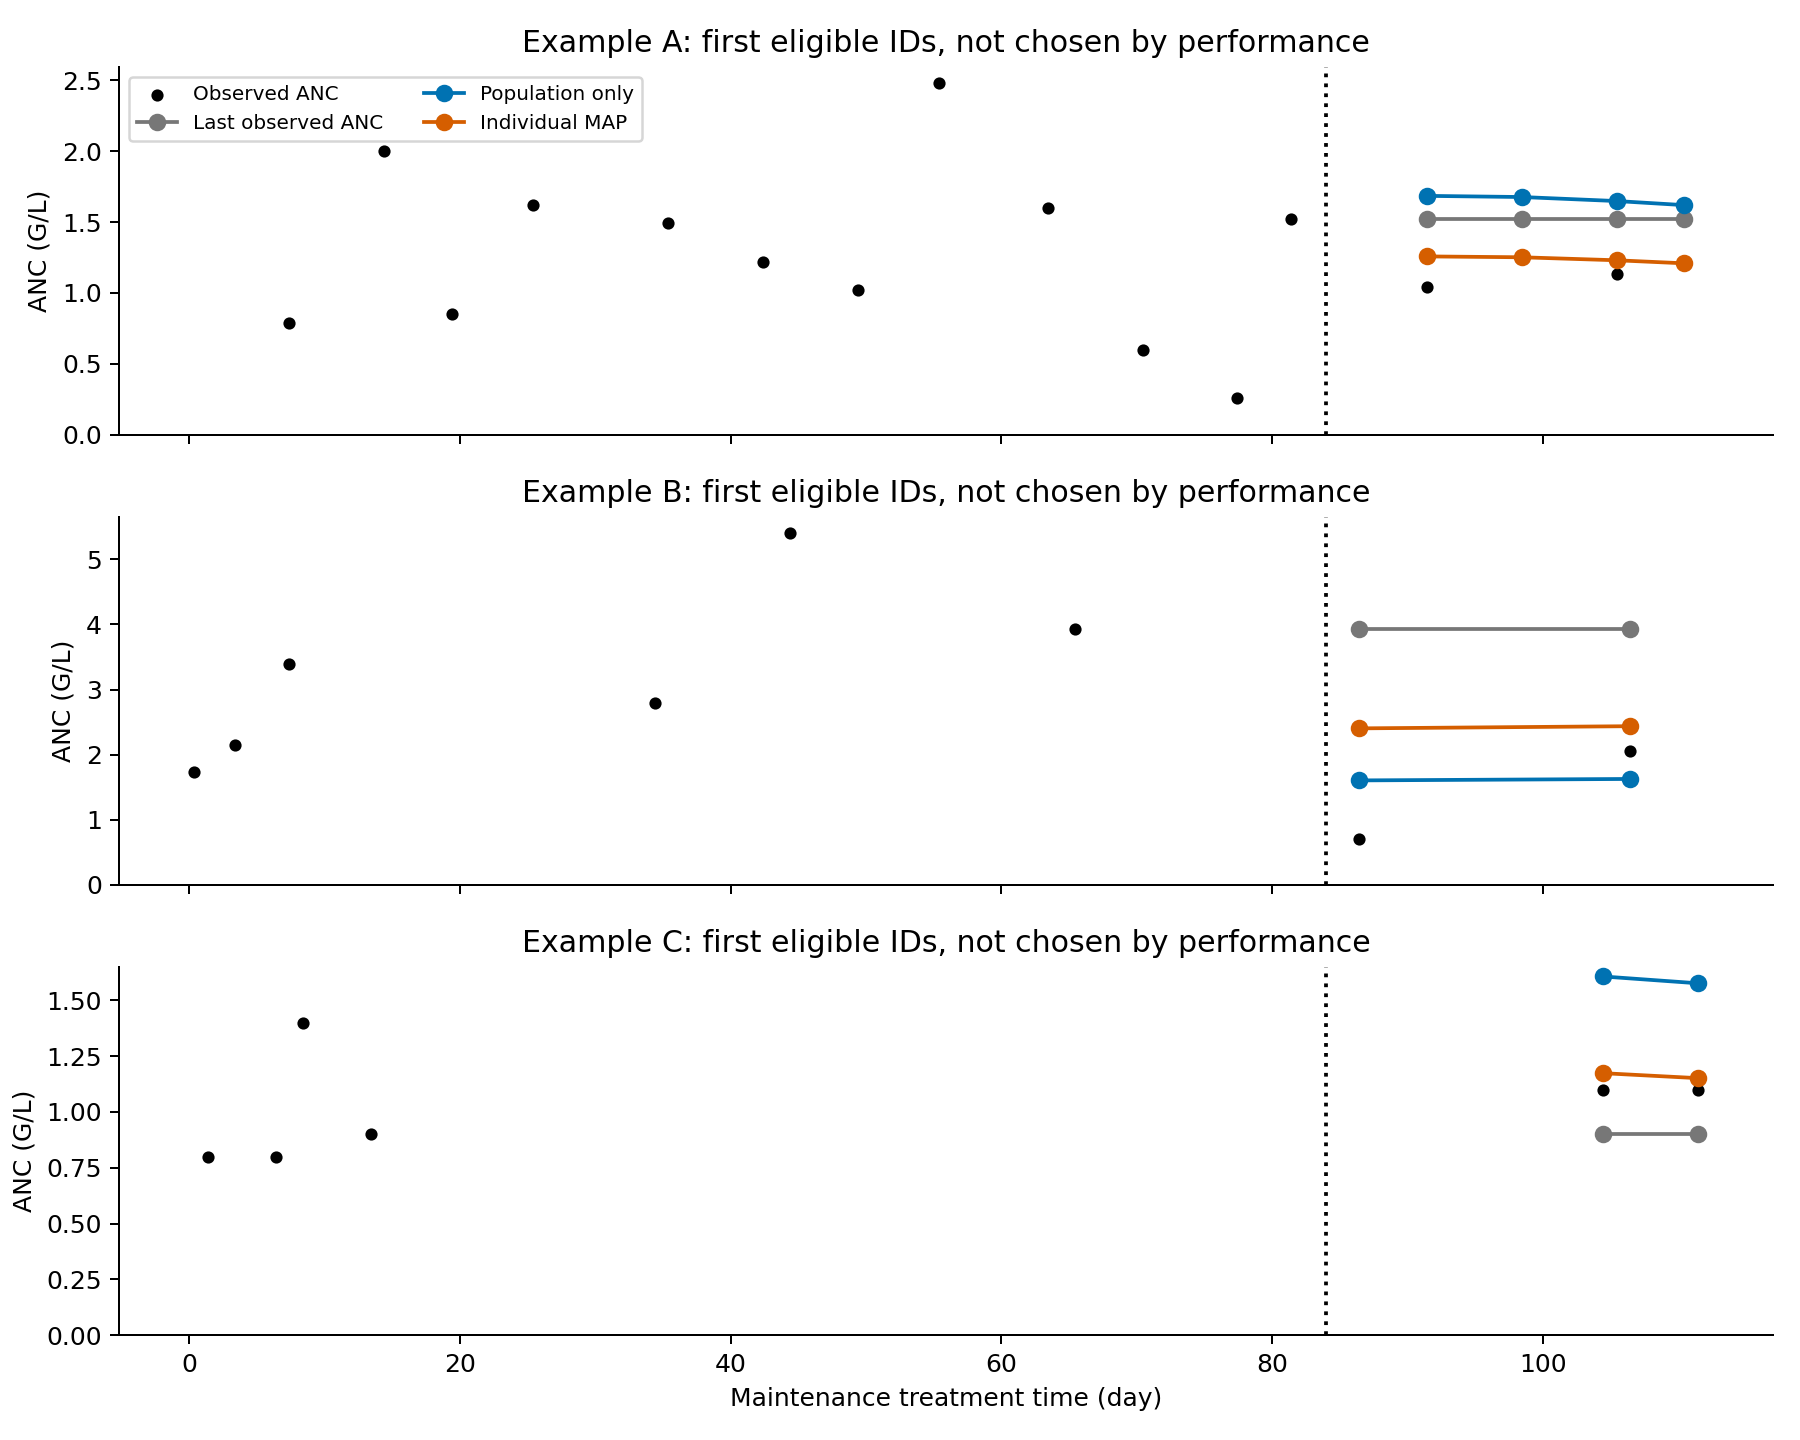
Figure 3. First three patients by ID, not selected for favorable errors. A/B/C are display aliases, not treatment recommendations. Updating need not predict abrupt ANC changes.
Gate before dose-rule comparison
The prespecified research gate required updating to beat last ANC in both input conditions with the upper 95% MAE-difference limit below zero, plus at least 80% coverage of empirical 90% bands. It was not met, so virtual-patient dose-rule optimization was not performed. Simulating treatment success solely in a model's own patients before checking forecasting risks favoring its assumptions.
ANC measures marrow suppression, not relapse or survival. Even controlling ANC would not alone establish preserved antileukemic efficacy.
Discussion
The audit selected observed rather than model-generated outcomes and separated patients, time and future dosing knowledge. Equation fitting and future prediction for dosing are different tasks. This same-dataset model does not fully represent site effects, adherence, infection, concomitant drugs, genotype or initial marrow state; the fixed-input coefficient discrepancy remains unresolved.
The narrow conclusion is that this model, unable to estimate individual sensitivity, did not establish added value from baseline-ANC MAP updating. It does not reject MIPD generally, updating of sensitivity or marrow state, or the possibility of optimizing 6-MP dosing. Karppinen's leukocyte/CRP study concerns another cohort and was not pooled here (3).
Data and code availability
Figures and aggregate tables are original calculations. Reproduction materials record input locations, hashes and commands. Original patient records and figures are not redistributed.
Code, aggregate tables and instructions.
Update, November 2, 2026: The approximately 24-fold difference between source Equation 2 and Table 2 was clarified as consistent with a time-unit conversion. The original implementation remains unconfirmed; calculated results and conditional conclusions are unchanged.
References
- Jost F, Zierk J, Le TTT, Raupach T, Rauh M, Suttorp M, et al. Model-Based Simulation of Maintenance Therapy of Childhood Acute Lymphoblastic Leukemia. Frontiers in Physiology. 2020;11:217. doi:10.3389/fphys.2020.00217.
- Friberg LE, Henningsson A, Maas H, Nguyen L, Karlsson MO. Model of Chemotherapy-Induced Myelosuppression With Parameter Consistency Across Drugs. Journal of Clinical Oncology. 2002;20(24):4713–4721. doi:10.1200/JCO.2002.02.140.
- Karppinen S, Lohi O, Vihola M. Prediction of leukocyte counts during paediatric acute lymphoblastic leukaemia maintenance therapy. Scientific Reports. 2019;9(1):18076. doi:10.1038/s41598-019-54492-5.