400 mg with a meal or 600 mg two hours apart: comparing taletrectinib dosing instructions with FDA's public models
FDA taletrectinib models compare food and dose conditions, distinguishing lower exposure, relative hepatic-toxicity hazards, and unverified regular-meal effects.
On this page
Introduction
I used models in public regulatory-review materials to compare taletrectinib exposure and relative hepatic-toxicity hazards across food and dose conditions. The calculation does not evaluate retained clinical efficacy or validate alternative administration regimens.
The 400 mg with-food condition reduces modeled exposure
For the ROS1-positive lung-cancer drug taletrectinib, I used the population pharmacokinetic (PopPK) and hepatic-toxicity exposure–response models in the FDA review. In 4,096 simulated individuals, I compared the approved 600 mg at least two hours before or after food with the 400 mg with a regular meal condition requested for postmarketing evaluation (1). The purpose is to quantify the questions that comparison needs to address.
The model's relative bioavailabilities were nearly equal for fed and two-hour fasting conditions: 1.58 and 1.55 relative to 10-hour fasting. Those coefficients came from different populations. The effect of a regular meal in patients remains uncertain. Thus, 400 mg with food is an exposure-reducing comparison, not an exposure-matching dose; the modeled matching dose is approximately 590 mg.
What does the comparison need to establish?
Taletrectinib received FDA approval in 2025 for ROS1 fusion-positive non-small-cell lung cancer. The approved regimen is 600 mg once daily at least two hours before or after a meal.
The FDA review considered the regimen generally acceptable but noted frequent ALT/AST elevations increasing with exposure. It also reported no clear exposure–efficacy relationship and considered the dose insufficiently optimized. Three observations supported further evaluation:
- In healthy participants, a high-fat meal increased AUC and Cmax approximately 1.5-fold versus 10-hour fasting, while fewer gastrointestinal events were observed: diarrhea 10% versus 28%, nausea 0% versus 12%.
- In a small randomized dose cohort, Study G208 cohort 5 with approximately 20 participants, ROS1-inhibitor-naive patients had similar response rates at 400 and 600 mg, with fewer grade ≥3 adverse events at 400 mg.
- There was no clear exposure–efficacy relationship, while higher exposure was associated with more adverse events in the safety analysis.
The FDA therefore requested a postmarketing study of safety, activity, and PK with 400 mg once daily with a regular meal in ROS1-inhibitor-naive patients.
Food-effect magnitude and real-world variation in administration are central. The review notes that two-hour separation can span overnight to two-hour fasting and create substantial bioavailability variability. I include this range when comparing conditions.
Models and coefficients
I used the applicant's final three-compartment PopPK model with first-order absorption and lag time from Table 74 of the original NDA 219713 review.
- Apparent clearance CL/F is 94.24 L/h, scales with body weight to power 0.37, and is multiplied by exp(−0.18) = 0.84 for Asian participants.
- Relative bioavailability Frel uses 10-hour fasting as 1. Two-hour fasting gives exp(0.44) = 1.55; fed administration gives exp(0.46) = 1.58.
- Interindividual variances are 0.03 for CL and 0.08 for Frel.
The two-hour fasting coefficient was estimated through comparison of patient trials with a 10-hour fasting healthy-participant trial. The fed coefficient came from a high-fat-meal study in healthy participants. The FDA stated that sparse regular-meal data did not support a robust estimate. In six patients measured under all three conditions, bioavailability increased sequentially from 10-hour fasting to two-hour fasting to a regular meal.
The weight reference was unspecified in the report, so I assumed 66 kg, the median of the PopPK population. This assumption does not affect regimen ratios within the same simulated individual.
Under linear PK, steady-state average concentration is
\[C_{\text{avg,ss}}=\frac{\bar F_{\text{rel}}\cdot \text{Dose}}{(CL/F)\cdot 24}\]
With dose in mg and CL/F in L/h, the equation gives mg/L. Values in the tables are converted to ng/mL by multiplying by 1,000.
Here \(\bar F_{\text{rel}}\) is the mean Frel weighted by the proportions of days in each food condition. This gives long-run average concentration for mixed food conditions, not the concentration time course on individual days. Individual Frel variability is assumed identical across food conditions; no additional day-to-day random variability is modeled.
For hepatic toxicity, I used the updated analysis in original Table 88. The Cox proportional-hazards model describes time to grade ≥3 ALT/AST elevation. Hazard ratio per 1 ng/mL of steady-state average concentration was 1.0018, with a 95% interval of 1.0005–1.0032. Baseline hazard was not published. Only relative hazards between regimens in the same simulated individuals can therefore be calculated. The association with response was statistically inconclusive (odds ratio 0.99896, p=0.31).
Population settings approximate the 312-person exposure–response dataset: 77% Asian, mean weight 65 kg with standard deviation 13 kg.
Agreement with the reported exposure distribution
Table 1. Steady-state average concentration under the approved condition and the regulatory exposure distribution.
| Average concentration at steady state, 600 mg with two-hour fasting | First quartile | Median | Third quartile |
|---|---|---|---|
| This model, 4,096 simulated individuals | 377 ng/mL | 475 ng/mL | 606 ng/mL |
| Regulatory exposure–response analysis, 312 participants | 407 ng/mL | 506 ng/mL | 616 ng/mL |
Quartiles divide ordered values into four equal-sized groups. The modeled median was approximately 6% lower. Regulatory values are individual post hoc estimates incorporating model and participant data and may include dose reductions and differing food conditions. Model 1st–99th percentiles, 225–1,090 ng/mL, fall inside the reported range of post hoc estimates of 149–1,430 ng/mL. These are different summary statistics, so this is only an orienting comparison.
Compare administration conditions
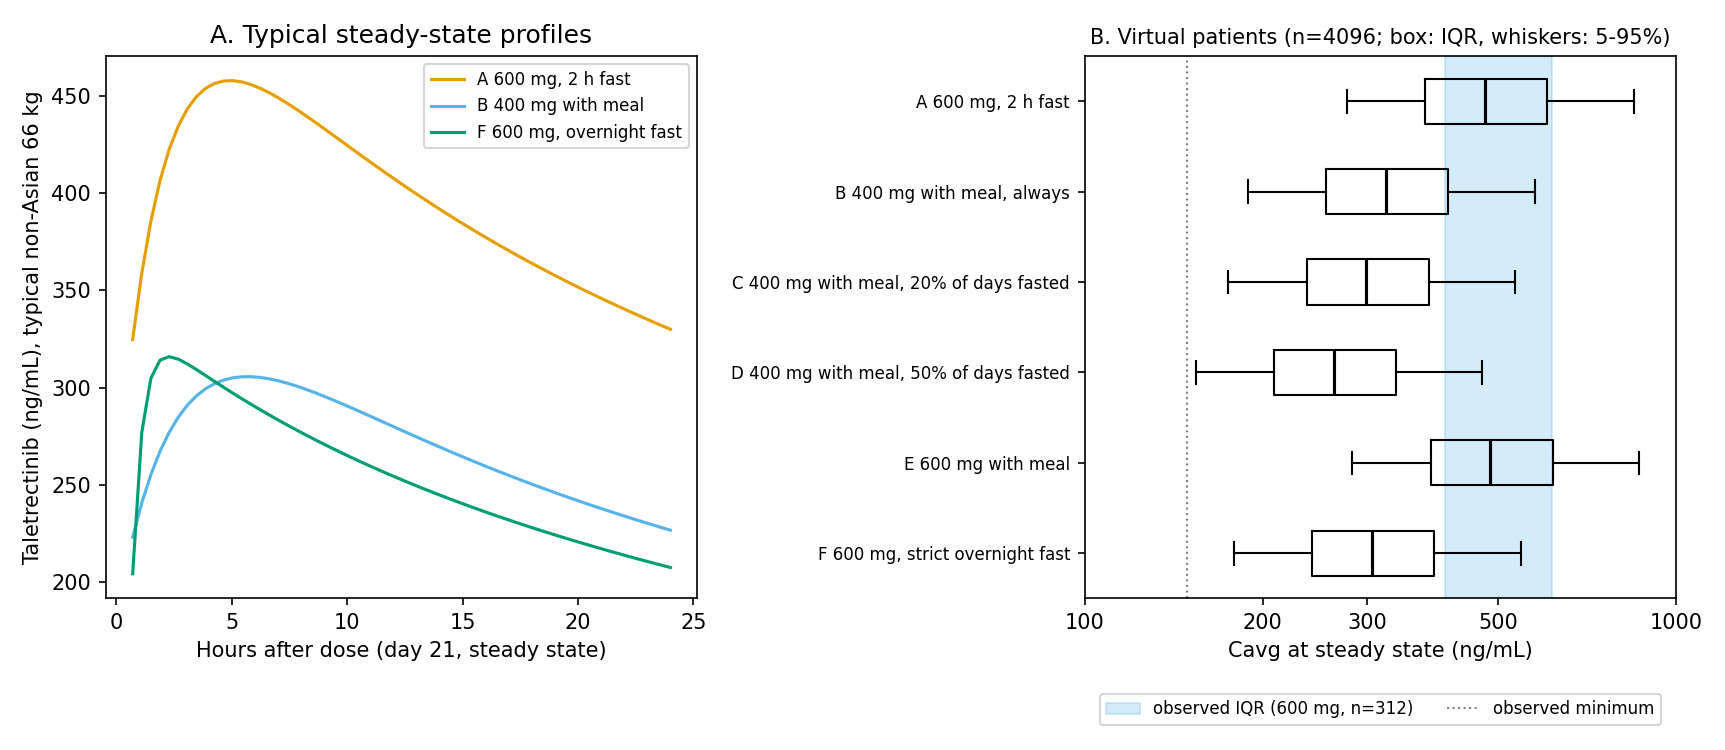
Figure 1. A: steady-state concentration profiles for a typical non-Asian individual weighing 66 kg, using a three-compartment model with lag. B: steady-state average concentrations in 4,096 simulated individuals. Boxes show interquartile ranges and whiskers 5th–95th percentiles. The blue band shows the reported 312-person interquartile range; the dotted line marks the reported minimum.
Table 2. Average concentrations and modeled relative hepatic-toxicity hazards by food and dose condition.
| Condition | Median average concentration | Ratio to approved condition | Below reported minimum | Modeled relative hepatic-toxicity hazard, 95% interval |
|---|---|---|---|---|
| A: 600 mg, two-hour separation, approved | 475 ng/mL | 1.00 | 0.0% | 1.00 |
| B: 400 mg with food | 323 ng/mL | 0.68 | 0.8% | 0.72 (0.53–0.93) |
| C: 400 mg with food, absent on 20% of days | 299 ng/mL | 0.63 | 1.6% | 0.69 (0.49–0.92) |
| D: 400 mg with food, absent on 50% of days | 263 ng/mL | 0.55 | 4.1% | 0.64 (0.42–0.90) |
| E: 600 mg with food | 485 ng/mL | 1.02 | 0.0% | 1.02 (0.94–1.12) |
| F: 600 mg after overnight fasting | 306 ng/mL | 0.64 | 1.2% | 0.70 (0.50–0.92) |
Relative hazard is the ratio of mean hazards between regimens within the same simulated population, using the approved condition as reference. Intervals incorporate uncertainty in the hazard ratio and both food coefficients. Standard errors were inferred from their 95% intervals and food coefficients were drawn independently. Because covariance was unpublished and comparisons depend on the ratio of those coefficients, intervals could be too wide or too narrow. “Food absent” days were treated as overnight, 10-hour fasting.
Asian and non-Asian groups had identical exposure ratios to the approved condition. Non-Asian baseline exposure was lower: median 410 ng/mL under approved conditions versus 496 ng/mL for Asian individuals. At 400 mg with food, 87% of non-Asian simulated individuals fell below the reported first quartile of 407 ng/mL. That quartile is not an efficacy threshold, but identifies a less densely represented region of the Cox-model data. Across the whole simulated population, 74% were below that quartile at 400 mg with food.
Sensitivity to a larger regular-meal effect
I assumed a regular-meal effect ranging from 0.9 to 1.3 times the model's fed value. This is an author-selected sensitivity range, not an estimated interval. With 400 mg, average concentration was then 0.61–0.88 times the approved-condition value and relative hazard was 0.67–0.89.
Discussion
Under these model coefficients, 400 mg with food reduces average concentration by approximately 30% versus the approved condition. Modeled relative hepatic-toxicity hazard is 0.72, with a broad interval of 0.53–0.93. Administration near overnight fasting under the two-hour separation instruction reduces exposure about as much as 400 mg with food. Variation in implementation can therefore be comparable to the dose difference.
Interpretation remains limited in several respects:
- Efficacy. No clear association with response was detected across the reported 149–1,430 ng/mL exposure range, but the analysis pooled ROS1-inhibitor-pretreated and naive patients. Preservation of activity at lower exposure has not been established in pretreated patients, including those with resistance mutations, or in brain metastases. Prospective evidence is particularly relevant to lower-exposure non-Asian patients.
- Overall safety. The model describes only grade ≥3 ALT/AST elevation. Absolute hepatic-toxicity incidence cannot be calculated without baseline hazard. Gastrointestinal symptoms, interstitial lung disease, and QT prolongation are absent.
- Regular meals. The coefficient comes from high-fat meals. The actual patient regular-meal effect could change the comparison.
- Other exposure determinants. CYP3A inhibitors and inducers, acid-reducing agents, missed doses, and toxicity-related reductions or interruptions can materially affect exposure, potentially more than food conditions, but were not modeled.
Limitations
- Coefficients were transcribed from the review, not estimated from individual data. Fixed-effect uncertainty was included only for the two food coefficients and the toxicity hazard ratio.
- The 66 kg reference weight is assumed. Individual Frel variability is identical across food conditions.
- The Cox model uses time-independent steady-state average concentration.
- Food-absent days are treated as overnight fasting, although actual fasting can be intermediate.
- Japanese approval status and dosing were not evaluated for this article.
Data and code availability
The code, inputs, and results are available together. python analysis/run_analysis.py regenerates tables and figures using fixed random seeds.
References
- US Food and Drug Administration. NDA 219713 Multi-disciplinary Review and Evaluation: IBTROZI (taletrectinib). 2025. Review. Tables 74, 77, 79, and 88; Section 19.4 and postmarketing requirements.