From correct analyses to decisions: reading OncologyBench
An audit of two public examples, seven original metadata fixtures and a hypothetical value-of-information calculation distinguish evidence scope from project decisions.
On this page
Background and objective
Does calculating a number correctly imply making an appropriate decision? OncologyBench, announced on October 13, 2026, evaluates this connection in oncology. Analytical agents produce results, and a separate agent synthesizes them into a treatment or research-and-development conclusion.
The developers reported that 57% of attempts passed every analytical Task, whereas 19% passed both all Tasks and the final Decision. Approximately two-thirds of attempts that passed every Task therefore failed the Decision assessment. These are results for specified tasks, environments and scoring criteria, not rates of incorrect decisions in clinical practice (1, 2).
Calling this a reasoning deficit alone leaves unclear what an analyst can improve. I examined the public examples, implemented simple checks on the context attached to results, and constructed a hypothetical decision model for valuing additional information.
Analyses and decisions are assessed separately
The full benchmark comprises 25 evaluations containing 92 analytical Tasks. Thirty-one model–harness combinations were each evaluated three times, yielding 2,325 attempts. These are repeated evaluation attempts, not 2,325 independent patient cases.
Each analytical agent receives its assigned data. The final Decision agent receives Task questions, answers, generated artifacts and execution records, rather than the raw data. Passing the full evaluation requires passing both the required Tasks and the Decision. The design separates analytical failures from failures in using analytical results (2).
Decisions are prose responses assessed by a rubric. One reported example selected the correct investment target but failed because the quantitative explanation for rejecting alternatives was insufficient. A failed score does not necessarily imply selecting the wrong action. The report identifies a single LLM judge, rubric wording and rescoring variability as limitations, and leaves agreement with clinicians for future validation. An offline, fixed-environment benchmark does not establish prospective clinical utility.
Public examples and audit methods
The public repository checked on October 14 contains two examples separate from the 25 full evaluations. I fixed commit c576d11144db9a5b2f8461d469e24ac05af2386a, read its JSON as data and counted grading nodes. I did not execute the original graders (3).
Table 1. Grading-node counts in the two public examples at the fixed commit.
| Public example | Analytical sections | Numeric-tolerance nodes | Numeric-range nodes | Predicate nodes | Positive/negative Decision-rubric criteria |
|---|---|---|---|---|---|
| Integration of postoperative molecular information and records | 5 | 4 | 0 | 10 | 6/5 |
| TGFβ–PD-L1 development decision | 4 | 9 | 2 | 6 | 7/4 |
These counts describe grading structure, not independent mandatory questions. The second example contains branches permitting alternative definitions; not every terminal node must be satisfied simultaneously. The two examples cannot estimate difficulty or pass rates for the full benchmark.
The development example integrates a human monotherapy study, mouse spatial measurements, tumor growth and cell-depletion experiments, and measurements of target effects. Some experiments record antibody identity and others do not (4). Integration therefore requires retaining the experimental system, intervention, comparator and endpoint, rather than aggregating numerical magnitudes alone.
Table 2. Context that must remain attached to evidence during integration.
| Context attached to a result | Distinction during integration |
|---|---|
| Human single-arm monotherapy study | Distinguish it from a comparative combination-treatment trial |
| Mouse spatial measurement | Its measured endpoint differs from a human clinical outcome |
| Experiment using a vehicle comparator | It does not measure added benefit over monotherapy |
| Experiment without recorded antibody identity | Do not assign the result to a specific antibody |
| Record without a documented finding | Distinguish unrecorded status from confirmed absence |
These differences do not automatically invalidate evidence. They delimit which claims it directly supports and which connections need additional assumptions or data. A trial can have value before direct clinical benefit has been established.
Seven original evidence–claim examples
I implemented this distinction in a small metadata checker. Seven original fixtures compare experimental system, intervention, comparator, endpoint and recording status with a proposed claim. Exact string matches are classified as compatible, different values as mismatched, and missing required information as unresolved. A claim that explicitly retains an unknown value is treated as compatible with that unknown record.
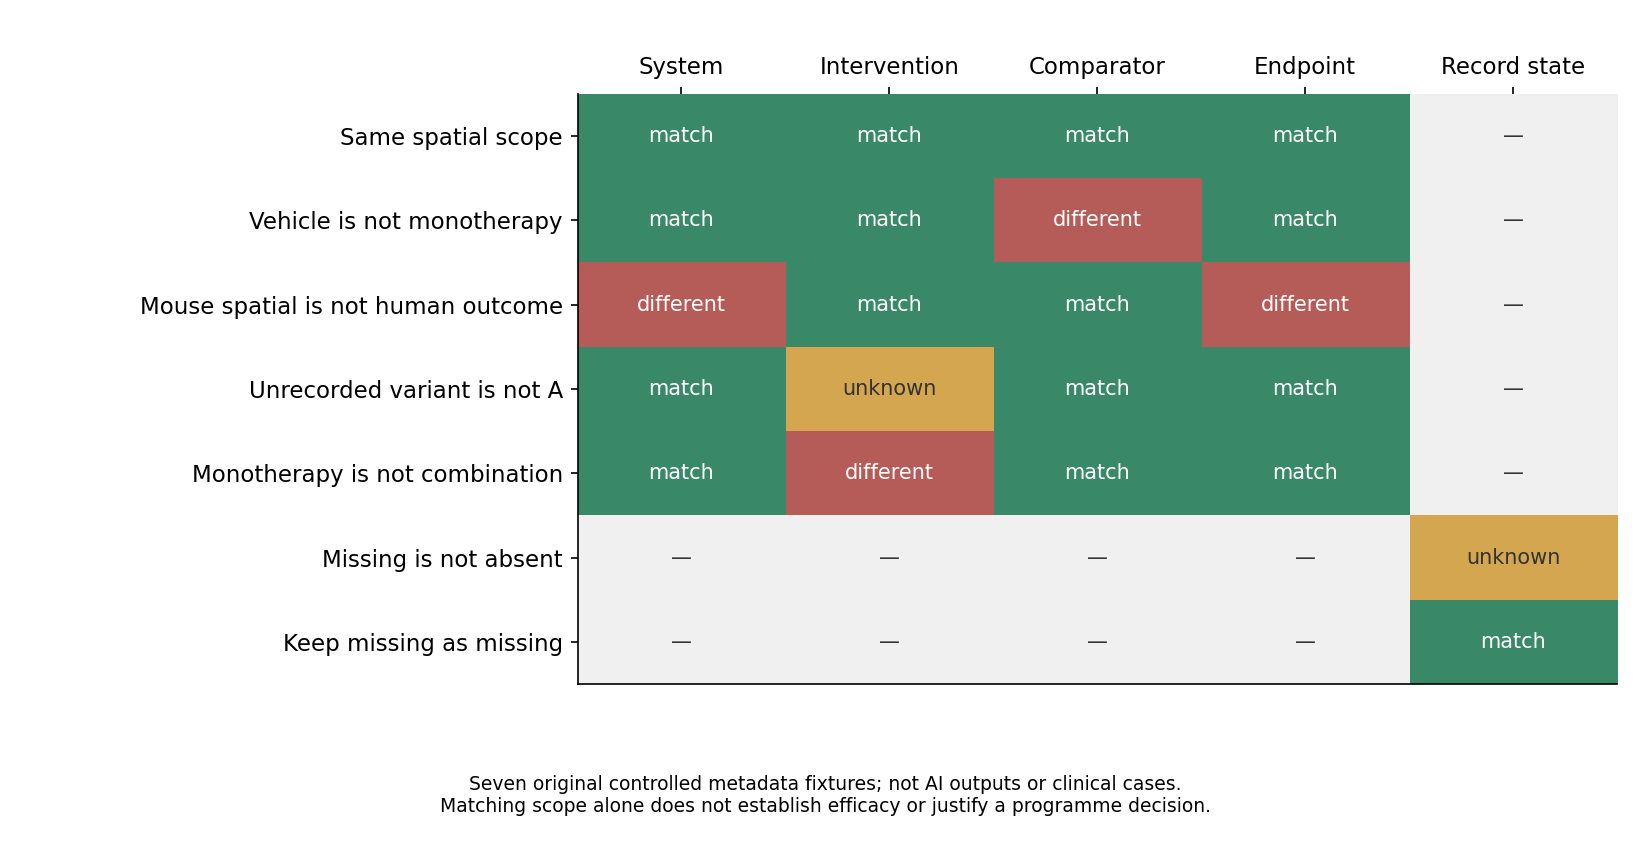
Figure 1. Compatibility between evidence and claims in seven original fixtures. A gray dash indicates a field for which the claim requests no comparison.
The results were two compatible, three mismatched and two unresolved cases. These deliberately constructed fixtures check program behavior; they do not measure AI accuracy. The checker detects examples that substitute a human clinical endpoint for a mouse spatial measurement or confuse comparator groups. It cannot assess synonyms, experimental quality or causal relationships. Compatibility does not mean that efficacy or continued development is sufficiently supported.
Keeping comparator and missingness information alongside a result preserves context that a downstream decision maker needs. The same issue applies to rows in omics and spatial-analysis result tables: their underlying comparisons must remain traceable.
The value of information depends on assumed utility
Even after preserving evidence context, a project may continue now, obtain more information or stop. The following is a hypothetical development-project example, not a patient-treatment or dosing model.
Let \(q\) be the probability of eventual project success. Continuing yields a gain of 100 upon success and a loss of 40 upon failure; stopping yields 0. These are arbitrary units, not values estimated from actual costs or health outcomes. Under risk neutrality:
\[ U_{\mathrm{continue}}=100q-40(1-q)=140q-40, \qquad U_{\mathrm{stop}}=0 \]
Here \(q\) is neither a benchmark pass rate nor a patient response rate. Real use would require estimating and calibrating a probability appropriate to the decision.
Assume an additional experiment costs 5, with sensitivity 0.8 and specificity 0.9. These are hypothetical operating characteristics relative to eventual project success or failure, rather than measured properties of an existing assay. After observing either result, the decision maker can choose again between continuing and stopping.
Joint probabilities of the result and project state give utility contributions of \(84q-4\) for a positive result and \(56q-36\) for a negative result. Stopping is selected whenever the corresponding continuation contribution is negative:
\[ U_{\mathrm{experiment}} =\max(84q-4,0)+\max(56q-36,0)-5 \]
The policy is not fixed to continue after every positive result and stop after every negative result.
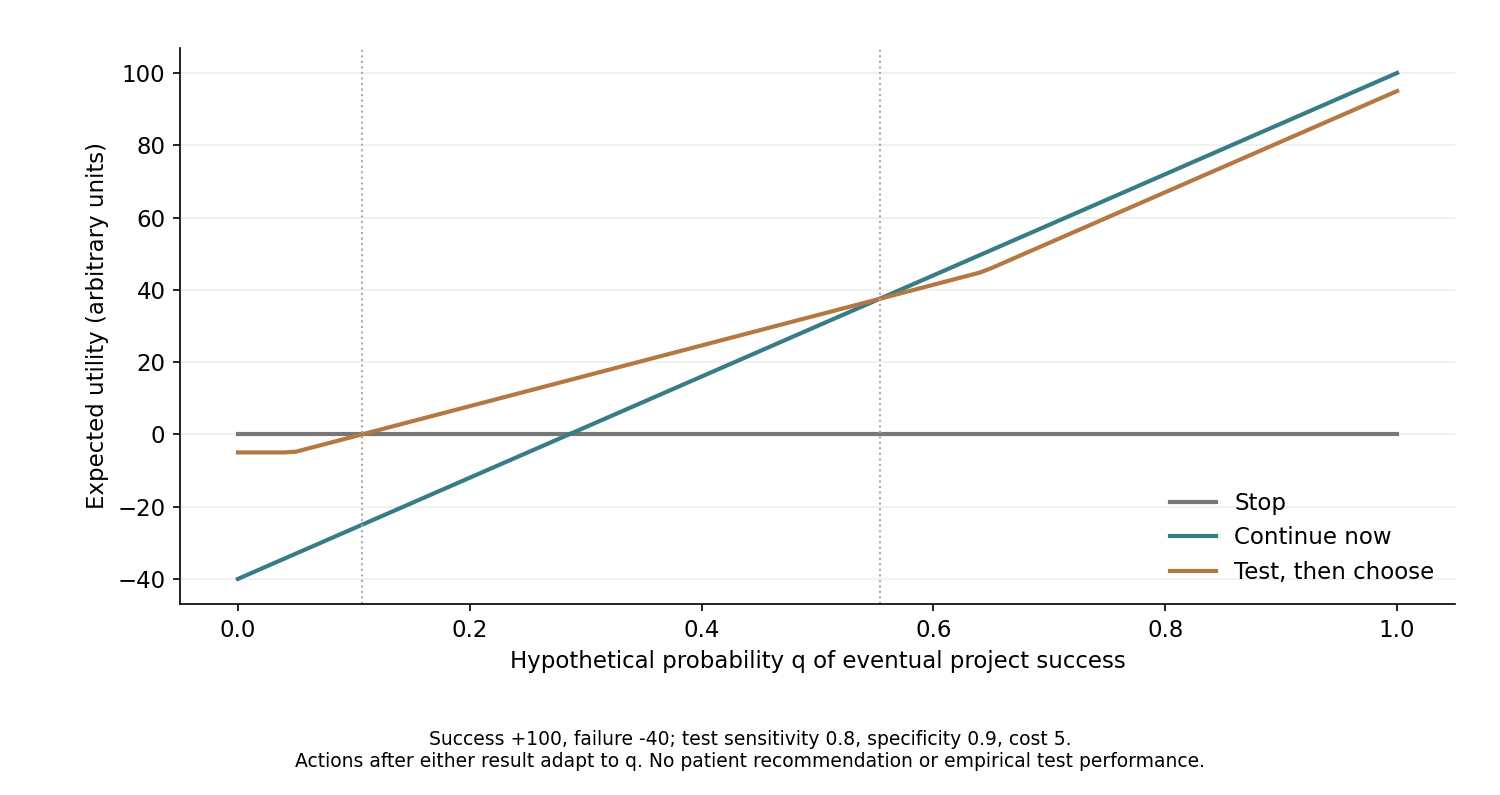
Figure 2. Expected utilities of three actions as a function of an assumed success probability. The probability is not estimated from empirical data.
Table 3. Expected utilities in the hypothetical scenario, in arbitrary units.
| Assumed \(q\) | Stop | Continue now | Experiment and decide again | Action with maximum expected utility |
|---|---|---|---|---|
| 0.2 | 0 | −12 | 7.8 | Experiment |
| 0.4 | 0 | 16 | 24.6 | Experiment |
| 0.8 | 0 | 72 | 67 | Continue now |
At \(q=0.2\), continuing immediately has negative expected utility, but choosing again after the experiment has sufficient value to offset its cost. At \(q=0.4\), immediate continuation already has positive expected utility, yet experimentation yields more.
At \(q=0.8\), continuation remains preferable even after a negative result. In this scenario the experiment changes no action, so the expected value of its information is 0 and its cost reduces utility by 5. More information does not necessarily improve a decision.
The optimal action changes at \(q=9/84\approx0.107\) and \(q=31/56\approx0.554\), with ties at each boundary. These thresholds depend on assumed gains, losses, experimental performance and cost; they are not universal development criteria.
The sensitivity analysis combines costs of 0, 5 and 20 with three sensitivity–specificity pairs across 101 values of \(q\), producing 909 rows. At \(q=0.4\) with unchanged experimental performance, raising cost to 20 reduces experimental utility to 9.6, below the 16 from immediate continuation. This two-state model assumes known probabilities and operating characteristics. It omits estimation uncertainty, delays, allocation across multiple candidates and risk aversion.
Discussion
OncologyBench shows that attempts passing analytical Tasks can still fail the final Decision assessment. Rubric success, however, is not a validation of expected-utility maximization, and my mathematical example does not reevaluate the public benchmark.
Connecting an analysis to a decision requires three explicit links: which intervention, comparator and endpoint the evidence concerns; how it updates beliefs about the future state of interest; and how losses from proceeding, forgone opportunities and information costs are compared.
Identical analytical values can support different claims when comparator groups, unrecorded conditions or extrapolation assumptions differ. The value of an additional experiment also depends on whether its result changes an action. In these examples, evidence compatibility and decision value therefore require separate examination.
Data and code availability
Download the code, seven original fixtures, result tables and figures. The implementation was checked with Python 3.12, NumPy 1.26.4 and Matplotlib 3.9.1. Run analysis.py, the 13 unit tests and plot.py in sequence. Ordinary reruns do not use the network.
The public-example structure counts can be reproduced from the included summary JSON, which records source URLs and SHA-256 hashes. To compare with the original files, audit_sources.py --fetch downloads the two examples at the fixed commit. The distribution does not contain original task text, answer keys, third-party figures or patient data. No LLM evaluation was performed.
References
- LatchBio. OncologyBench: Benchmarking AI Decisions in Cancer Research and Treatment. 2026 Oct 13. Blog post.
- Badshah J, Saye BK, Banerjee A, Shrishrimal S, Ramasamy R, Flood D, et al. OncologyBench: Benchmarking multiagent AI systems on grounded systems in oncology research and treatment. LatchBio; 2026. Technical report.
- LatchBio. oncologybench [Software repository]. Commit c576d11144db9a5b2f8461d469e24ac05af2386a. GitHub. Accessed 2026 Oct 14.
- LatchBio. TGFβ–PD-L1 programme review [Benchmark example]. In: oncologybench. Commit c576d11144db9a5b2f8461d469e24ac05af2386a. Evaluation JSON. Accessed 2026 Oct 14.