How to take the first step: comparing elranatamab step-up designs and CRS with public models
Published elranatamab PK and first-dose CRS models compare step-up hypotheses while separating recalibration, later-dose risk, and untested clinical benefit.
On this page
How far does the model support a lower first dose?
I combined a published population pharmacokinetic (PopPK) model of the BCMA×CD3 bispecific antibody elranatamab with an exposure–response model for cytokine release syndrome (CRS), comparing initial step-up designs in 4,096 simulated individuals (1).
This is hypothesis generation for prospective comparisons, specifically a lower starting dose confined to patients with high tumor burden. It is not a treatment recommendation; actual administration follows approved dosing and prescribing information. Calculations use published coefficients without re-estimation from patient records.
Why the first dose?
CRS with T-cell-engaging bispecific antibodies concentrates in the first few administrations. Step-up dosing and premedication are therefore standard countermeasures. The approved elranatamab design gives 12 mg on day 1, 32 mg on day 4, and 76 mg weekly from day 8. Subsequent interval extensions are outside this article.
The open-access 2026 Clinical Pharmacokinetics PopPK/exposure–response paper analyzed 183 MagnetisMM-3 participants. It related first-dose CRS probability to early exposure and tumor burden. No significant exposure relationship was found after the second step-up dose; fewer than 10% experienced CRS after the first full dose, precluding model estimation. The paper's simulations address whether re-priming is required after interruptions, rather than comparing starting-dose designs. I examine the latter question here.
Other CD3 bispecific antibodies have explored additional steps. For epcoritamab, a three-step regimen combined with hydration and dexamethasone prophylaxis reduced CRS frequency and severity relative to two steps. This should not be attributed to the number of steps alone (2). First-dose size is one of several design choices.
Models and coefficients
Pharmacokinetics
I implemented the published equations and coefficients, including binding to soluble BCMA (sBCMA), the circulating target molecule. Drug–sBCMA binding is assumed to remain in quasi-equilibrium.
\[\frac{dA_1}{dt}=k_aA_3-k_{12}(A_1-X)+k_{21}A_2-CL\,C_f-CL_{cx}C_{cx},\quad \frac{dA_3}{dt}=-k_aA_3\]
\[\frac{dA_4}{dt}=k_{syn}-CL_s\,C_{fs}-CL_{cx}C_{cx},\quad K_d=\frac{C_f\,C_{fs}}{C_{cx}}\]
Here \(A_1\) is total central drug amount, free plus complexed; \(A_3\) is the subcutaneous dosing depot; \(A_4\) is sBCMA; and \(X\) is complex amount. The quadratic equilibrium equation for dissociation constant \(K_d\) determines \(X\).
Principal coefficients are:
- CL 0.324 L/day, Vc 4.777 L, Vp 2.83 L, Q 0.225 L/day.
- F 0.562 and ka 0.287/day.
- Kd 3.138 nM and baseline sBCMA 6.914 nM.
Covariates follow the published equations:
- Female CL is multiplied by (1−0.492).
- Vc scales with body weight relative to 71.45 kg to power 1.017.
- ka scales with age relative to 66 years to power −1.459.
Weight and age were generated from the paper's overall means and standard deviations. Published interindividual CVs, including 100% for CL, were converted to lognormal distributions. sBCMA synthesis \(k_{syn}\) was set to give predose steady state.
Exposure–response for CRS
I used the any-grade CRS logistic regression after the first step-up dose in original Supplementary Table S2:
\[\mathrm{logit}\,P=-7.65+1.14\,[\text{high tumor burden}]+1.35\,\ln C_{\text{day 4}}\]
The logit is the logarithm of the odds, probability divided by one minus probability. \(C_{\text{day 4}}\) is free elranatamab concentration in ng/mL immediately before the second dose on day 4. High tumor burden means bone-marrow plasma cells ≥80%, serum M-protein ≥5 g/dL, or serum free light chains ≥5,000 mg/L under the paper's definition. It is not interchangeable with a routine clinical staging system.
The regression was estimated under trial conditions including premedication and does not distinguish CRS severity. Coefficient covariances were unavailable; uncertainty was approximated by independent normal distributions inferred from individual 95% intervals.
Does the implementation reproduce published exposures?
Table 1. Published exposure summaries and conditional model outputs.
| Endpoint, free elranatamab geometric mean | This implementation | Published | Ratio |
|---|---|---|---|
| Cmax after first full dose, days 8–15 | 4,372 ng/mL | 3,795 ng/mL | 1.15 |
| Mean concentration over the same interval | 3,570 ng/mL | 3,083 ng/mL | 1.16 |
| Week-24 mean concentration with weekly dosing, all individuals | 19,380 ng/mL | 32,025 ng/mL | 0.61 |
| Same endpoint, CL ≤0.3 L/day, 61% of simulated individuals | 31,893 ng/mL | 32,025 ng/mL | 1.00 |
Early exposure was approximately 15% high. The week-24 difference may reflect earlier dropout among nonresponders. The description of original Supplementary Figure S2 excludes simulated individuals with CL above 0.3 L/day after approximately day 84. Applying the same condition brought the results into agreement, but the large excluded fraction limits this to a consistency check.
An initial two-compartment calculation ignoring sBCMA binding gave first-full-dose Cmax 1.88 times the paper's value and was unsuitable. sBCMA binding matters particularly during low-dose exposure.
At the approved 12 mg starting dose, day-4 concentration had geometric mean 240 ng/mL and 5th–95th percentiles 61–741. Original regression coefficients predicted 51% first-dose CRS, above the observed 43%, whose 95% interval was 36–50%. Main comparisons therefore shift the logistic intercept by −0.37 to match that observation. This shift also absorbs the approximately 15% overprediction of early exposure. Uncertainty calculations include uncertainty in the observed event rate.
Compare starting-dose designs
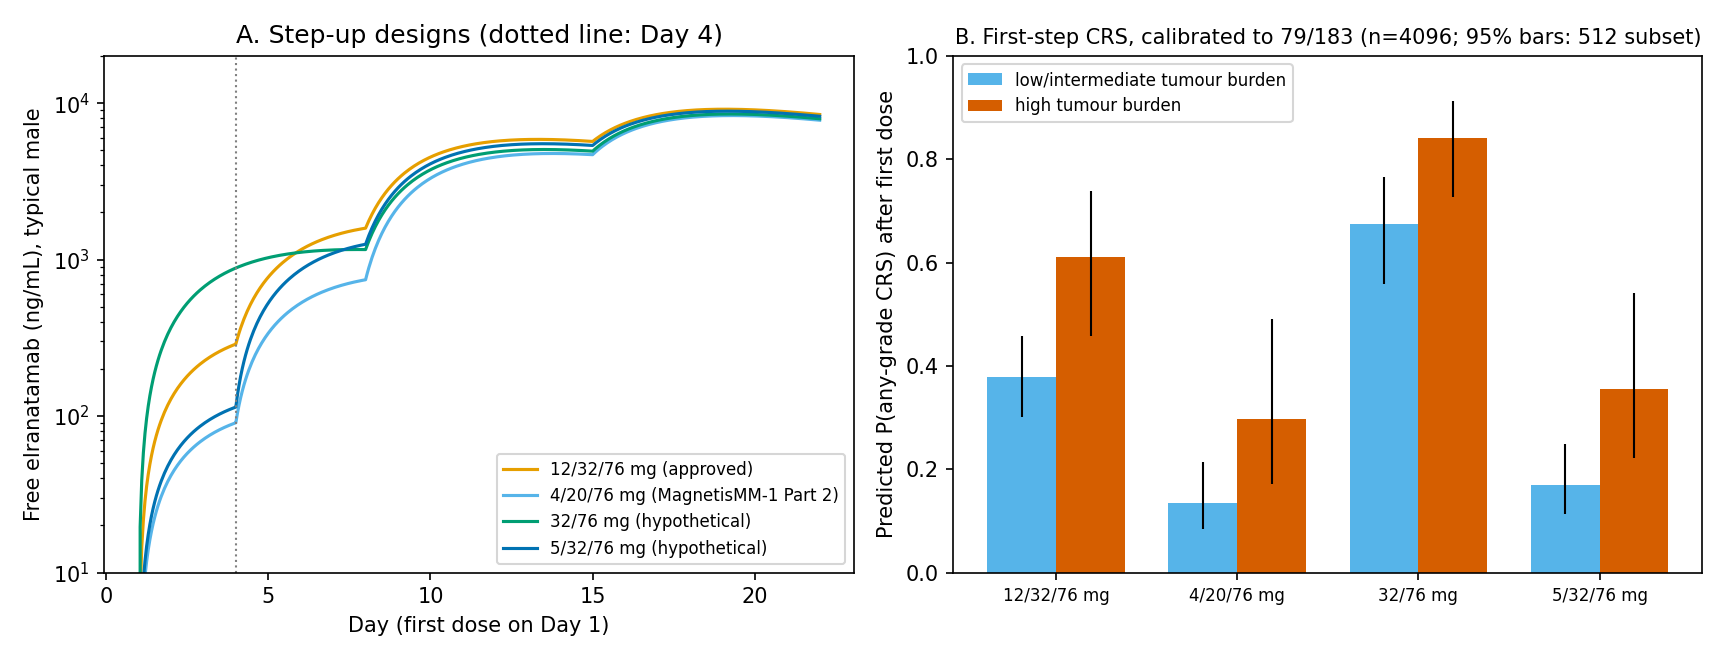
Figure 1. A: free elranatamab concentration for a typical male; the dotted line marks day 4. B: predicted first-dose CRS probability after recalibration to observations, using 4,096 simulated individuals. Whiskers show 95% uncertainty intervals for coefficients and observed event rate, calculated using a subset of 512 simulated individuals.
Table 2. Exposure and recalibrated first-dose CRS predictions by design.
| Design | Day-4 concentration, geometric mean | Predicted CRS probability, low/moderate burden | Predicted CRS probability, high burden | Preday-8-dose concentration relative to approved design |
|---|---|---|---|---|
| 12/32/76 mg, approved | 240 ng/mL | 0.38 (0.30–0.46) | 0.61 (0.46–0.74) | 1.00 |
| 4/20/76 mg, phase I | 75 ng/mL | 0.13 (0.09–0.21) | 0.30 (0.17–0.49) | 0.49 |
| 5/32/76 mg, hypothetical | 94 ng/mL | 0.17 (0.11–0.25) | 0.36 (0.22–0.54) | 0.80 |
| 32/76 mg, hypothetical omission of first step | 723 ng/mL | 0.68 (0.56–0.77) | 0.84 (0.73–0.91) | 0.72 |
Parentheses enclose central 95% ranges from 500 draws of coefficients and observed event rate, recalibrating the approved-dose prediction to the drawn rate each time. The 4/20/76 mg design was used in MagnetisMM-1 Part 2, with 43 participants. The 32/76 mg design has a day-8 ratio below 1 because it lacks a second dose on day 4: cumulative dose before day 8 is 32 rather than 44 mg.
Starting-dose size largely determines predicted first-dose CRS. Day-4 concentration was approximately dose proportional between 2 and 12 mg, increasing from 37 to 240 ng/mL. The high-burden coefficient 1.14 corresponds to an exposure multiplier of \(e^{1.14/1.35}=2.33\).
A starting dose of approximately 5.5 mg in high-burden individuals matched the low/moderate-burden 12 mg probability of 0.38. Matching geometric-mean concentration gave the same 5.5 mg estimate, with 2.7–9.3 mg from coefficient uncertainty. That interval excludes the 2% of draws requiring less than 2 mg, making its lower bound somewhat higher than an untruncated result.
Discussion
Within the published exposure–response relationship, starting dose largely determines first-dose CRS probability. The high-burden effect is equivalent to approximately 2.3-fold exposure. Lowering only the high-burden starting dose can mathematically match the approved-design prediction for low/moderate burden.
Several further questions remain outside this calculation:
- Later-dose CRS. A lower start creates larger concentration increases after the second and third doses. The second-dose analysis found no significant exposure relationship, and there were too few events after the first full dose to fit a model.
- Extrapolation to other designs. The regression was estimated in 183 recipients of 12/32/76 mg. Concentrations such as 75 ng/mL lie away from the center of those data. The original regression also used individual post hoc exposures, whereas this article uses population-simulated exposures. I did not compare predictions with actual CRS outcomes for 4/20/76 mg.
- Efficacy. Concentrations almost converge across designs after day 15, as Figure 1A shows, but the model cannot determine whether differences during the first two weeks alter response.
- Clinical benefit. Differences in any-grade CRS probability do not establish differences in severe CRS, hospitalization duration, tocilizumab use, ICANS, or infections. Those outcomes were not evaluated.
Limitations
- Coefficients were transcribed rather than estimated from individual data. PK fixed-effect uncertainty and coefficient covariances are excluded. CRS-regression coefficient uncertainty is handled by the independent approximation described above. Published sBCMA-clearance IIV, with CV 448%, was retained.
- Early exposure is overpredicted by approximately 15%. CRS predictions depend on the −0.37 intercept recalibration.
- High-burden prevalence was set to 22.5%, based on 169 MagnetisMM-3 participants with known classification. Weight and age distributions use the paper's overall means and standard deviations.
- CD3 binding is absent, as in the published model.
Data and code availability
The code, inputs, and results are available together. python analysis/run_analysis.py regenerates tables and figures with fixed random seeds. Tests run with python -m unittest discover -s analysis -p "test_*.py".
References
- Hibma JE, Irby D, Liu A, Elmeliegy M, King LE, Gifondorwa D, et al. Elranatamab Population Pharmacokinetics and Exposure–Response for Cytokine Release Syndrome in Patients with Relapsed or Refractory Multiple Myeloma. Clinical Pharmacokinetics. 2026;65(8):1173–1192. doi:10.1007/s40262-026-01663-z.
- Sinnollareddy M, Sanghavi K, Gibiansky L, Li T, Putnins M, Mohamed MEF, et al. Exposure–Response Analyses to Inform the Optimal Epcoritamab Monotherapy Dosing Regimen in Relapsed or Refractory Follicular Lymphoma. Clinical Pharmacokinetics. 2026;65(9):1415–1428. doi:10.1007/s40262-026-01661-1.