When does the survival benefit of tarlatamab maintenance accumulate?
Public DeLLphi-305 survival curves are integrated over a common 12-month window to describe accumulated absolute survival and progression-free time.
On this page
A mortality hazard ratio of 0.42 does not describe how much additional survival time has accumulated by a particular date. Integrating the public DeLLphi-305 survival curves over the first 12 months gives an approximately 1.91-month difference in restricted mean overall survival and a 3.80-month difference in restricted mean progression-free survival.
These are neither differences in reported medians nor new estimates of lifetime survival. They compare time spent alive, or alive without progression, within the same 12-month window.
Aligning the window from randomization to maintenance treatment
DeLLphi-305 randomized patients with extensive-stage small-cell lung cancer who had not progressed after initial chemoimmunotherapy to tarlatamab plus durvalumab or durvalumab alone. The October 24, 2026 report gave median OS of 21.1 versus 12.7 months and an OS hazard ratio of 0.42 (Pérol et al., 2026).
The numerical inputs for this reanalysis come specifically from the public presentation: the OS curve on page 17 and the PFS curve on page 19. Both contain plotted curves and numbers at risk at three-month intervals. The calculations do not rely on a claim that the full journal article was retrieved (October 24 public presentation, pp.17,19).
The question of interest (QOI) is how much absolute survival-time difference accumulated between maintenance randomization and a common time horizon. The context of use (COU) is interpretation of the magnitude and time scale of published clinical results. It does not compare delayed initiation, earlier initiation, or stopping treatment at a specified time.
| Measure | Combination | Durvalumab alone |
|---|---|---|
| Randomized participants | 282 | 281 |
| OS number at risk at 12 months | 222 | 146 |
| PFS number at risk at 12 months | 86 | 18 |
A risk set counts participants still followed without the relevant event at that time. It is not the survival probability multiplied by the initial sample size. Censoring makes these quantities different, and this table alone does not recover individual event times.
Twelve months is within the observed curve range and retains participants at risk in both arms. The control PFS risk set is nevertheless only 18, so the later curve is supported by relatively few participants. This horizon was chosen for this descriptive reanalysis; it is not presented as a prespecified primary analysis of the trial.
Integrating the area under each curve
For the public Kaplan–Meier curve \(\widehat S_g(t)\) of group \(g\) and restriction horizon \(\tau\), the restricted mean survival time is
\[ \widehat{\mathrm{RMST}}_g(\tau)=\int_0^\tau\widehat S_g(t)\,dt. \]
The contrast is
\[ \Delta(\tau)=\widehat{\mathrm{RMST}}_{\mathrm{combo}}(\tau)-\widehat{\mathrm{RMST}}_{\mathrm{control}}(\tau). \]
For OS it estimates the mean difference in time alive within the restriction window. For PFS it estimates the corresponding difference in time without progression or death.
Rather than hand-drawing the curves from a screenshot, the script reads vector vertices from paths identified by color and monotonicity. Horizontal segments retain the left survival value until the next vertex; vertical segments have zero width and add no area. No pseudo-individual records are created and no survival tail is extrapolated. Extracted vertices are saved in outputs/tables/curve-vertices.csv, with transcribed numbers at risk in risk-sets.csv.
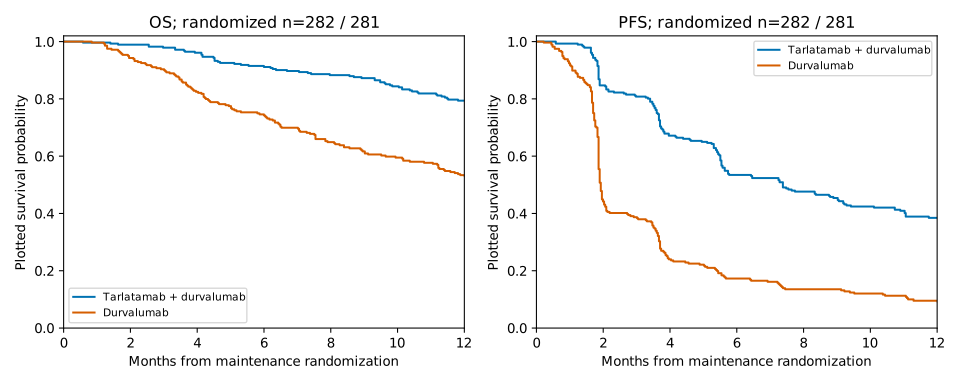
Censoring marks and annotations overlap the lines in the original figure. Extraction selects the colored curve path itself and checks that time does not move backwards and survival does not increase. Rounding in the source PDF geometry remains, so this is not identical to re-estimation from original trial records.
Accumulated benefit depends on the horizon
The following values are generated by analysis/run.py. All entries are in months (outputs/tables/rmst.csv).
| Horizon | OS combination RMST | OS control RMST | OS difference | PFS combination RMST | PFS control RMST | PFS difference |
|---|---|---|---|---|---|---|
| 3 months | 2.98 | 2.89 | 0.08 | 2.78 | 2.17 | 0.61 |
| 6 months | 5.81 | 5.31 | 0.50 | 4.79 | 2.92 | 1.86 |
| 9 months | 8.48 | 7.32 | 1.16 | 6.28 | 3.37 | 2.91 |
| 12 months | 10.97 | 9.06 | 1.91 | 7.51 | 3.71 | 3.80 |
The 1.91-month OS difference at 12 months is smaller than the 8.4-month difference in reported medians. That is not a contradiction. A median compares the times at which each survival curve crosses 50%; a 12-month RMST compares the areas from zero to 12 months. They are different estimands.
Likewise, a 58% lower hazard does not mean a 58-percentage-point lower probability of death at 12 months. The extracted 12-month OS estimates are approximately 79.4% versus 53.4%, another quantity distinct from the hazard ratio.
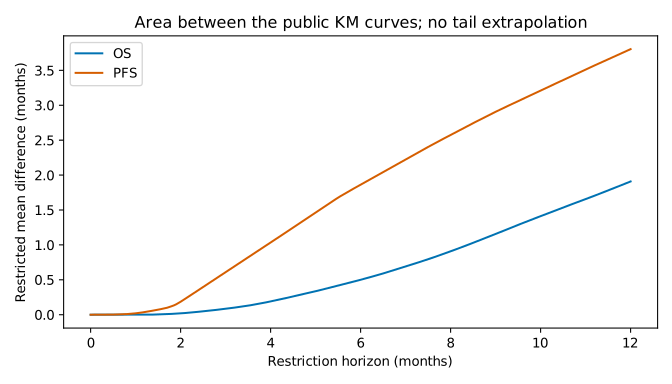
The PFS difference accumulated earlier than the OS difference. This describes the two plotted endpoints. It does not establish a mediating mechanism in which the PFS change caused the OS difference.
Interval shape and reading sensitivity
For each three-month interval, the calculation
\[ \bar\lambda_g(a,b)=-\frac{\log\{\widehat S_g(b)/\widehat S_g(a)\}}{b-a} \]
summarizes the average decline in log survival. The combination-to-control ratios for OS were 0.213, 0.363, 0.235 and 0.654 over months 0–3, 3–6, 6–9 and 9–12. For PFS they were 0.225, 0.512, 0.670 and 0.472 (outputs/tables/interval-rates.csv).
These are descriptive summaries of the plotted curves, not re-estimates of the reported stratified Cox hazard ratio. Their variation is not a formal test of proportional hazards. Reduced risk sets and reading precision also affect the intervals, so the ratios cannot identify a month at which pharmacologic activity starts to weaken.
For a reading-sensitivity analysis, each arm's entire trace was independently shifted by up to ±0.05 month horizontally and ±0.005 in survival probability in 2,000 fixed-seed scenarios. Whole-trace shifts preserve monotonicity, with probabilities clipped to 0–1. The ranges of 12-month RMST differences were 1.78–2.04 months for OS and 3.65–3.95 months for PFS (outputs/tables/reading-sensitivity.csv).
These are ranges under specified reading perturbations, not 95% confidence intervals for sampling patients. Individual event and censoring times and the required covariance information are unavailable to this analysis. No new claim of statistical significance is made.
This does not answer when treatment should start
The contrast applies to patients who remained progression-free through initial therapy and entered maintenance randomization. The same difference cannot simply be assigned to everyone who started first-line treatment.
The two-arm comparison also does not identify pharmacologic synergy, the separate contribution of each drug, or the effect of delaying tarlatamab by three months. Integrating these curves cannot determine whether benefit persists after a fixed treatment duration. Treatment assignment, actual duration tolerated and drug exposure are distinct variables.
The reproducible result from these public curves is an absolute time difference within a common 12-month horizon: approximately 1.91 months for OS and 3.80 months for PFS. Reading this quantity alongside hazard ratios and medians makes the meaning of benefit more explicit.
Data and code availability
Code, extracted coordinates and aggregate tables. Run analysis/download_sources.py to verify the public PDF hash, then analysis/run.py to regenerate the tables and figures. The original PDF and original slide images are excluded from the companion. The supplied figures are newly drawn and the numerical integrations are independent calculations.
References
Pérol M, Yoshida T, Ahn MJ, et al. Tarlatamab–Durvalumab Maintenance for Extensive-Stage Small-Cell Lung Cancer. New England Journal of Medicine. Published October 24, 2026. doi:10.1056/NEJMoa2609482.
Amgen. ESMO 2026 Update. October 24, 2026. Pages 17 and 19, public plotted OS and PFS data used for this independent numerical integration. Public presentation.
Cite this article
Kumakura D. When does the survival benefit of tarlatamab maintenance accumulate? An independent integration of public DeLLphi-305 survival curves. 2026.