What can aggregate randomized data establish about treatment duration and benefit–risk?
SCOT trial efficacy and neuropathy compared with endpoint-specific denominators, uncertainty, missingness bounds and limits of joint benefit–risk inference.
Key findings
- From published SCOT results, 3 vs 6 months of adjuvant chemotherapy changed 3-year DFS by −0.4 points (−2.6 to +1.8), while grade ≥2 neuropathy fell by 33.4 points (26.9 to 39.5).
- Bounds that assign every missing neuropathy grade adversely still give a 27.6–36.6-point reduction within the safety cohort, so the toxicity benefit is robust to missing grades.
- Efficacy and toxicity come from different populations, so a joint 'disease-free without neuropathy' probability is not identified; non-inferiority is not the same as identical efficacy.
On this page
- Question and scope
- Source data and denominators
- Estimate an evidence vector before a utility
- Reconstructed results
- A missingness analysis that does not pretend to recover everyone
- Why “disease-free without neuropathy” is not identified
- Check the later follow-up
- Implications for model-informed development
- Reproduce
- References
A shorter treatment schedule can reduce toxicity while leaving uncertainty about efficacy. These are separate dimensions of evidence. Combining them into one attractive number can hide different analysis populations, missing outcomes, and unmeasured patient preferences.
This article uses public SCOT trial results to reconstruct a duration comparison, quantify its uncertainty, and identify what the available data cannot estimate. It is an aggregate-data evidence analysis, not a patient-level reanalysis or a clinical treatment recommendation.
日本語要約:公開RCTの有効性と毒性を、分母・不確実性・欠測を分けて比較した。神経毒性の低下は明確だったが、非劣性を「同じ有効性」と読み替えることや、異なる解析集団の数値をそのまま個人のbenefit–riskへまとめることはできない。
Question and scope
The question of interest is how a randomized treatment-duration comparison informs the balance between efficacy preservation and toxicity reduction. The context of use is study design and evidence appraisal. A wrong inference could overstate what a shorter regimen preserves, or promote a utility-weighted ranking whose assumptions are hidden.
The roadmap initially suggested a different trial. SCOT was selected because its original efficacy and safety tables are openly retrievable. This change preserves the duration question but changes the clinical setting. Individual participant data were not obtained; there is no claim of individual outcome modeling, NLME estimation, or exposure–response analysis here.
Source data and denominators
SCOT randomized treatment duration, three versus six months, for high-risk stage II or stage III colorectal cancer. CAPOX or FOLFOX was selected before randomization. The 2018 report used an adjusted DFS hazard-ratio noninferiority margin of 1.13. Its published tables and text are the source inputs below. Iveson et al., Lancet Oncology, 2018.
| Published input | Three months | Six months |
|---|---|---|
| Randomized participants | 3,044 | 3,044 |
| DFS intention-to-treat population | 3,035 | 3,030 |
| Three-year DFS | 76.7% | 77.1% |
| Safety cohort | 434 | 434 |
| Sensory-neuropathy grade available | 420 | 409 |
| Grade ≥2 sensory neuropathy | 103 | 237 |
| Grade ≥3 sensory neuropathy | 18 | 67 |
| Missing neuropathy grade | 14 | 25 |
The acquisition script downloads the official open-access XML and records its SHA-256. Grade ≥3 counts and missingness are extracted directly from Table 2; grade ≥2 counts are reconciled against the original report. No survival events are invented from rounded survival percentages.
Estimate an evidence vector before a utility
The primary comparison retains three quantities:
- Three-year DFS difference, three minus six months, using the published survival estimate and its published interval.
- Adjusted DFS HR, three versus six months, compared with the trial margin.
- Neuropathy risk reduction, six minus three months, recomputed from observed safety counts.
These quantities answer different questions. A hazard ratio does not become an absolute risk difference by subtraction. A Kaplan–Meier survival estimate is not a binomial proportion with the randomized count as its denominator. Toxicity proportions from a subset cannot be silently given the efficacy population's denominator.
For neuropathy, each arm's binomial Wilson interval was computed and combined using a component-based interval for the risk difference. For a positive difference d = p6 − p3, its lower limit is d minus the square root of (p6 − L6)² + (U3 − p3)²; the upper limit uses (U6 − p6)² + (p3 − L3)². These intervals describe sampling uncertainty among observed safety participants. They do not account for selecting the safety subset.
Reconstructed results
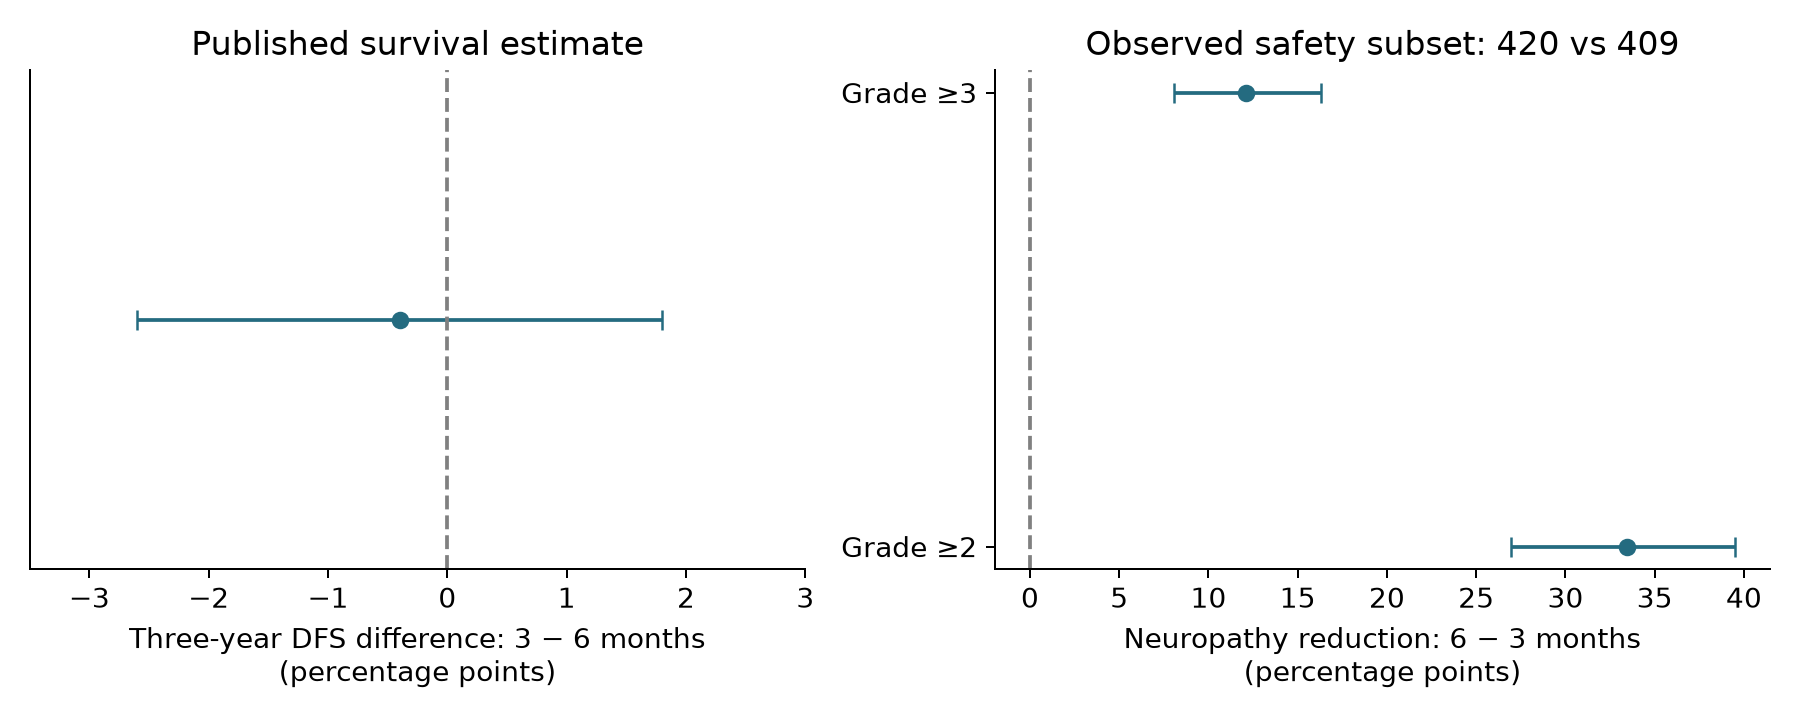
| Quantity | Estimate | 95% interval | Interpretation |
|---|---|---|---|
| Three-year DFS difference, 3 − 6 months | −0.4 percentage points | −2.6 to +1.8 | Published survival estimate; both small loss and gain remain compatible |
| Grade ≥2 neuropathy reduction, 6 − 3 months | 33.4 percentage points | 26.9 to 39.5 | Recomputed in participants with available grades |
| Grade ≥3 neuropathy reduction, 6 − 3 months | 12.1 percentage points | 8.0 to 16.3 | Recomputed from the maximum-grade table |
The derived toxicity differences are large compared with the observed efficacy difference, but the comparison is not a patient-level trade-off. The efficacy and safety endpoints are measured on different populations and time scales.
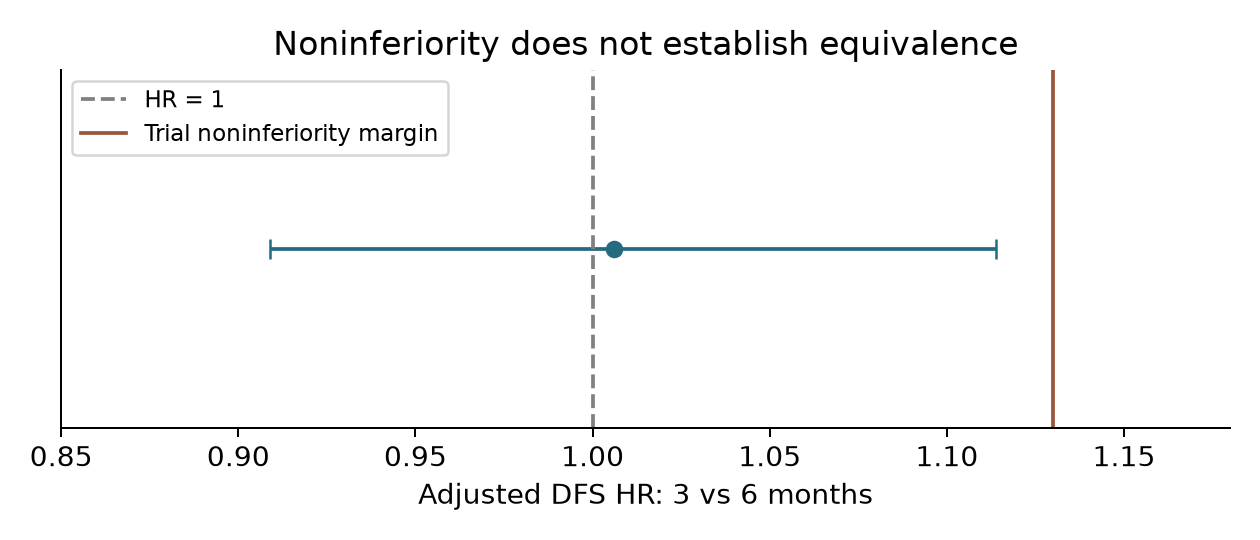
The reported DFS HR was 1.006 with an interval of 0.909–1.114, below the prespecified upper margin of 1.13. This is a margin-based inference. It does not establish identical efficacy or prove an arbitrarily stricter margin. Conversely, the absolute DFS interval is not the trial's primary adjusted HR test; the two must not be substituted for each other.
A missingness analysis that does not pretend to recover everyone
Within the 434-per-arm safety cohort, assign every missing grade first in the direction least favorable to shorter treatment: all 14 missing three-month grades are ≥2 events and none of the 25 missing six-month grades are events. Reverse the assignments for the opposite bound.
The resulting grade ≥2 risk-reduction bounds are 27.6 to 36.6 percentage points. These are identification bounds under arbitrary missing grades, not a confidence interval. They are computed independently of the complete-case sampling interval.
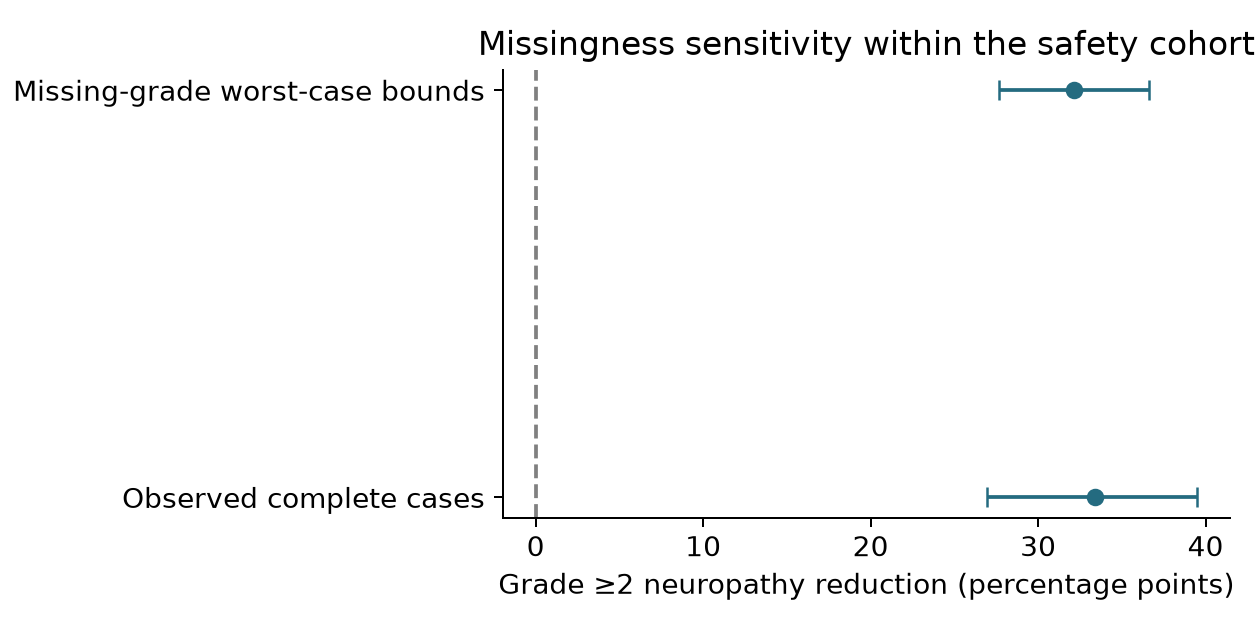
The direction of the safety difference survives these assignments within this cohort. It does not follow that the same bound applies to all randomized participants. The majority of trial participants are outside the detailed safety cohort; giving their unmeasured grades an invented value would create a different sensitivity problem. Representativeness, adverse-event ascertainment, and the observation process remain relevant.
Why “disease-free without neuropathy” is not identified
A potentially attractive endpoint is the probability of being disease-free at three years without important neuropathy. Marginal survival and marginal toxicity do not identify that probability: it depends on which people experienced both outcomes. Even if both margins came from the same population, their joint probability would require additional information or explicit bounds. Here, the denominator mismatch comes first.
Similarly, the covariance of the two treatment-effect estimates is unknown. A simulated probability of positive net benefit would depend on a fabricated joint distribution unless its assumptions were stated. This analysis therefore does not generate that probability or label one schedule “optimal.”
As a purely hypothetical preference calculation, suppose both marginal differences could be transported to one population and define benefit as DFS probability plus w times avoided grade ≥2 neuropathy. At the point estimates, −0.004 + w×0.3342 changes sign at w=0.0120. Replacing the point efficacy loss with the largest loss in the reported DFS interval moves that arithmetic threshold to 0.0778. These numbers are not preference estimates, confidence limits for a utility, or recommendations. Their purpose is to make the required valuation and transport assumptions visible.
Check the later follow-up
The 2026 final report gives five-year OS of 82.4% in both arms, with overall OS HR 0.96 (main-text interval 0.86–1.07). Reported regimen-specific HRs differ: CAPOX 0.90 (0.78–1.03), FOLFOX 1.10 (0.93–1.34). The abstract prints a different lower overall limit, 0.8; this analysis records the discrepancy and uses the main text. Iveson et al., Journal of Clinical Oncology, 2026.
This later report adds context; its survival follow-up is not merged with the earlier toxicity counts to manufacture a new joint endpoint. Regimen choice was not randomized, so the subgroup contrast is not a randomized head-to-head CAPOX versus FOLFOX comparison. Failure to meet a subgroup noninferiority criterion also does not alone prove inferiority.
Implications for model-informed development
A useful duration study must specify what efficacy decrement matters, how cumulative toxicity is measured, and whose preferences the decision reflects. Collecting safety and efficacy jointly supports analyses that published margins alone cannot supply. Longitudinal toxicity, recovery, discontinuation, and dose intensity would further distinguish schedule burden from delivered exposure.
The present data support a transparent evidence comparison and a robust within-cohort toxicity sensitivity analysis. They do not support individualized benefit–risk, a continuous duration–response curve, extrapolation to an untested duration, or PK-guided dose selection. The value of the analysis is in preserving these boundaries while making the observed differences easy to inspect.
Reproduce
The companion contains acquisition and extraction code, aggregate inputs and results, figures, and an executed notebook. Downloaded source articles remain outside the archive. See README. Numerical results can be traced to results/extracted-inputs.json and results/analysis.json.
References
- Iveson TJ et al. SCOT primary report. doi:10.1016/S1470-2045(18)30093-7, 2018. Open access, CC BY 4.0.
- Iveson TJ et al. SCOT final results. doi:10.1200/JCO-25-00621, 2026. Main-text and abstract interval discrepancy retained in the source audit.
Download code, aggregate results and executed notebook
Cite this article
Kumakura, D. (2026). What can aggregate randomized data establish about treatment duration and benefit–risk?. daikikumakura.github.io. https://daikikumakura.github.io/writing/treatment-duration-benefit-risk.html