Amivantamab IV/SC PK bridging: is matching AUC sufficient?
Conditional numerical simulations of the public EMA model distinguish systemic input, finite-window AUC and predose concentration. Reference profiles are contrasted with observed PALOMA-3 geometric mean ratios without claiming clinical noninferiority, population reproduction or individual switching predictions.
On this page
- Background and objective
- Question and intended use
- Connecting public sources
- Model equations
- Schedule and evaluation windows
- Matching F-adjusted input does not match profiles
- Trial GMRs and reference-condition ratios differ
- Covariate sensitivity
- Numerical accuracy and model uncertainty
- Discussion
- Data and code availability
- References
Background and objective
Literature checked on October 14, 2026. These are conditional numerical calculations with published PopPK estimates, not refitting of individual data. Trial results and calculations in this article are distinguished.
When moving an antibody from intravenous, IV, to subcutaneous, SC, administration, is adjustment for bioavailability sufficient? PALOMA-3 compared both routes for the EGFR/MET bispecific antibody amivantamab (1). SC uses a larger dose but slower absorption, so similar systemic input does not guarantee the same concentration profile.
I independently implemented the joint IV/SC model in the EMA assessment (2). Reference-condition SC/IV ratios were 1.079 for Cycle 2 AUC and 1.191 for its starting trough. One exposure ratio conceals endpoint differences. These calculations do not establish PK noninferiority.
Question and intended use
Table 1. Question and scope.
| Item | Definition |
|---|---|
| Question | How do SC/IV AUC and trough ratios differ under the PALOMA-3 schedule and public model? How do F correction, absorption and covariates affect comparison? |
| Intended use | Research interpretation of PK bridging and reproducible public-model endpoints, not individual administration or selection of a new SC dose |
| Analysis | ODE calculation with estimated parameters; no new fitting, individual NLME or trial reanalysis |
The model helps explain existing bridging evidence. Units, dosing events, mass balance and integration precision are checked because implementation errors could misattribute schedule or absorption effects. It is not a standalone clinical decision model.
Connecting public sources
Table 2. Sources and their scope.
| Source | Information used | Limitation |
|---|---|---|
| PALOMA-3 (1) | Observed PK and geometric mean ratios, GMRs, with 90% CIs | Routes compared from treatment initiation, not switching an existing IV-treated individual |
| EMA/61503/2025, pp. 28–31, 39, 48–49 (2) | Structure, coefficients, covariates, schedule and diagnostics | Not Table 3 as named in the text: p. 30 contains the actual Table 4; image checked visually |
| IV SmPC (3) | Initial 350 mg, next-day remainder and infusion rates | PALOMA-3 schedule takes priority over other indications or regions |
| 2026 PALOMA report (4) | SC development and alternative-interval context | No Q3W or Q4W simulation here |
The joint model used 1,026 participants and 21,860 quantifiable concentrations. Original individual concentrations and joint covariate distributions were unavailable. PALOMA-3 overlaps model-development studies, so the comparison is not independent external validation. The SmPC F geometric mean of 0.666 summarizes individual estimates; it is not interchangeable with structural reference F=0.683.
Model equations
Time is hours, amounts mg and volumes liters. Concentrations in mg/L equal µg/mL numerically. F times the SC dose enters an absorption compartment after lag ALAG; IV enters centrally at its infusion rate.
\[ C_1=A_1/V_1,\qquad C_2=A_2/V_2 \]
\[ \frac{dA_{SC}}{dt}=-k_aA_{SC} \]
\[ \frac{dA_1}{dt}=R_{IV}(t)+k_aA_{SC}-CL\,C_1 -\frac{V_{max}C_1}{K_m+C_1}-Q(C_1-C_2) \]
\[ \frac{dA_2}{dt}=Q(C_1-C_2) \]
F is already included in the depot amount and is not applied again. Elimination combines linear and parallel Michaelis–Menten components.
Table 3. Reference structural parameters.
| Parameter | Reference | Unit |
|---|---|---|
| F | 0.683 | — |
| \(k_a\) | 0.0172 | h⁻¹ |
| ALAG | 8.44 | h |
| CL | 0.00889 | L/h |
| \(V_1,V_2\) | 2.63, 2.41 | L |
| Q | 0.0373 | L/h |
| \(V_{max}\) | 0.751 | mg/h |
| \(K_m\) | 18.4 | µg/mL |
These are reference-covariate fixed effects from EMA Table 4, not averages of individual estimates. Published covariate equations use S=1 for men and 0 for women:
\[ F=\operatorname{expit}\{\operatorname{logit}(0.683)-0.0363(BMI-24)\} \]
\[ k_a=0.0172(Age/63)^{-0.521} \]
\[ CL=0.00889(WT/60)^{0.48}(ALB/40)^{-0.52} (Age/63)^{-0.218}(1+0.206S) \]
\[ V_1=2.63(WT/60)^{0.421}(1+0.121S),\qquad V_2=2.41(WT/60)^{0.421} \]
WT is kg, ALB g/L and Age years. Reference conditions are 60 kg, BMI 24, age 63, female and ALB 40 g/L, with random effects η fixed at zero. This is neither an average trial participant nor a population-average curve.
Schedule and evaluation windows
PALOMA-3 uses 28-day cycles and concomitant lazertinib, but only amivantamab concentration is modeled here (2).
Table 4. Weight-dependent PALOMA-3 doses.
| Weight | IV | SC |
|---|---|---|
| <80 kg | 1050 mg | 1600 mg |
| ≥80 kg | 1400 mg | 2240 mg |
Cycle 1 doses occur on Days 1, 8, 15 and 22; later cycles on Days 1 and 15. The initial IV dose is split into 350 mg on Day 1 and the remainder on Day 2. Relative to t=0 at treatment initiation, Cycle 2 Day 1 predose is 672 h and Cycle 4 Day 1 predose 2016 h.
\[ AUC_{C2,D1-D15}=\int_{672}^{1008}C_1(t)\,dt \]
AUC units mg·h/L equal µg·h/mL numerically. Troughs are predose values. Integration is split at SC lag and IV infusion events.
Infusions assume 250 mL and uninterrupted SmPC rates: the initial 350 mg uses 50 mL/h for two hours then 75 mL/h; the 60 kg Day-2 infusion uses the same rates. Week 2 uses 85 mL/h and later infusions 125 mL/h. Halved and doubled durations explore unmodeled interruptions or rate changes. SC injection over minutes is approximated as instantaneous depot administration followed by absorption. Cmax is not used to declare clinical equivalence.
Matching F-adjusted input does not match profiles
At the same reference background I compared IV 1050 mg, SC 1600 mg, SC 1050 mg and SC 1050/F mg. The last two are mathematical controls, not proposed doses.
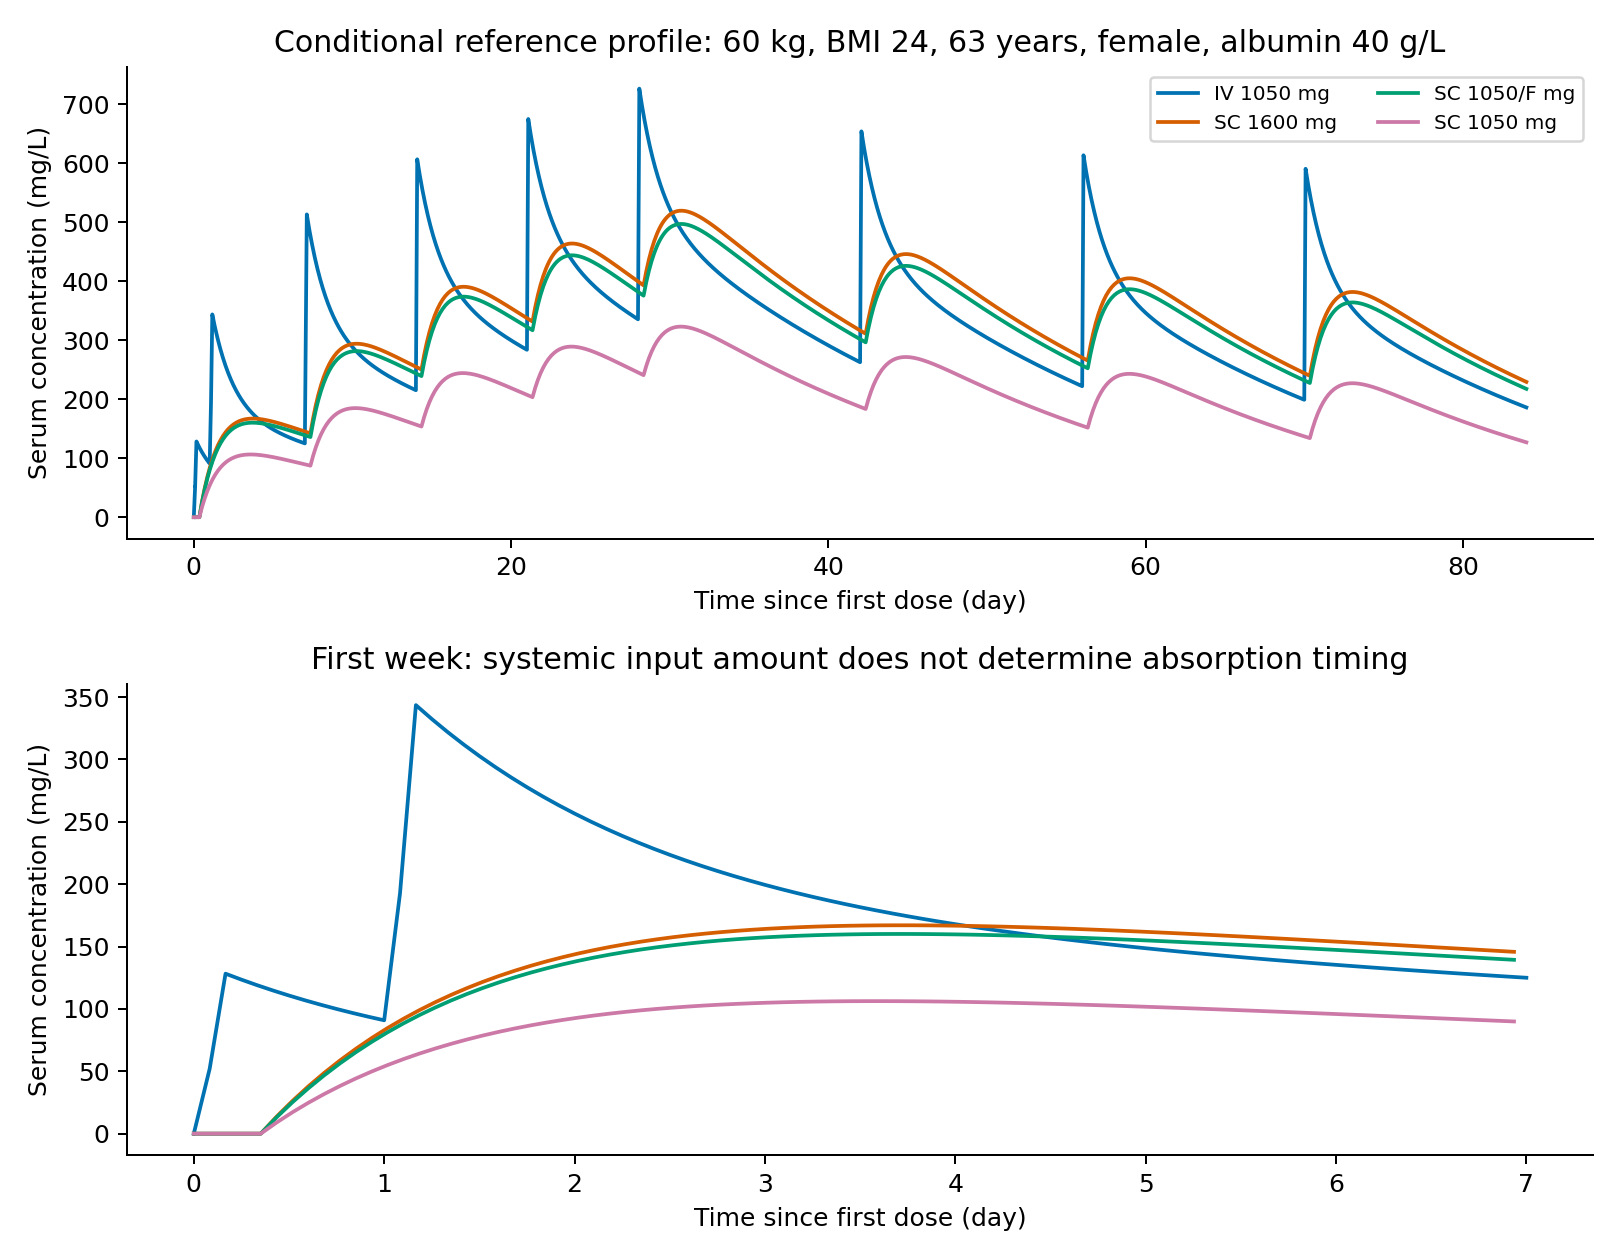
Figure 1. Reference-background IV/SC concentration profiles.
F×1600/1050 gives a systemic-input ratio of 1.041, not the finite-window AUC ratio. Delayed absorption, nonlinear elimination and drug remaining from earlier doses prevent equating input matching with trough matching.
Even SC 1050/F mg, which matches systemic input, gave Cycle 2 AUC ratio 1.031, Cycle 2 trough ratio 1.139 and Cycle 4 trough ratio 1.169. Results are in outputs/tables/input-controls.csv. F×Dose/CL would describe interval AUC for linear PK at adequate steady state; parallel nonlinear elimination and induction-period endpoints preclude direct use here.
Trial GMRs and reference-condition ratios differ
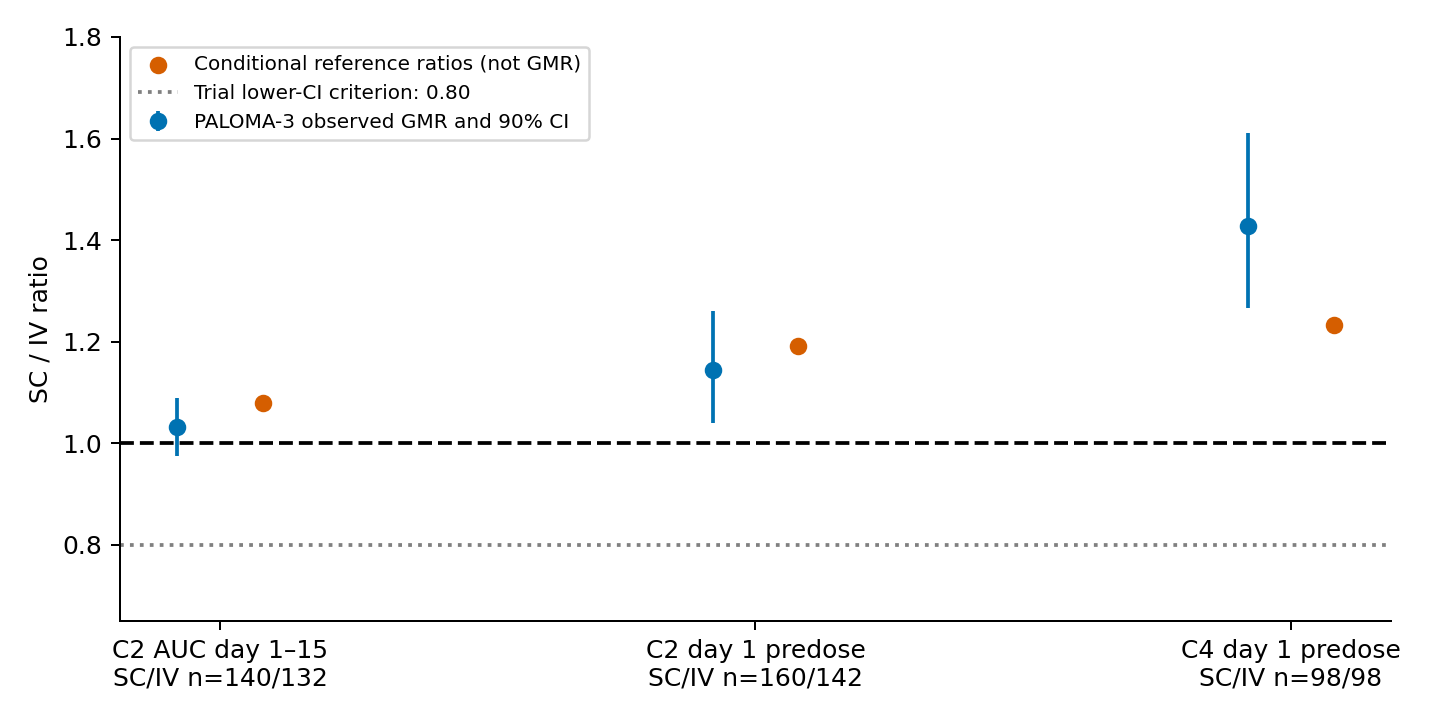
Figure 2. Conditional ratios and observed population GMRs have different estimands.
Table 5. Conditional model ratios versus observed trial GMRs.
| Endpoint | Conditional SC/IV | Observed PALOMA-3 GMR (90% CI), EMA Table 11 | Observed SC / IV n |
|---|---|---|---|
| Cycle 2 AUC Day 1–15 | 1.079 | 1.032 (0.976–1.090) | 140 / 132 |
| Cycle 2 Day 1 trough | 1.191 | 1.145 (1.040–1.261) | 160 / 142 |
| Cycle 4 Day 1 trough | 1.233 | 1.427 (1.266–1.610) | 98 / 98 |
Outputs are in outputs/tables/trial-context.csv. The Cycle 4 discrepancy prevents claiming full reproduction of population PK. A fixed-background η=0 ratio need not equal a GMR estimated from different participants. Covariates, variability, actual dosing histories, evaluable-patient selection and model limitations could contribute, but their contributions cannot be separated. The difference is not termed an observed-data prediction-error rate.
Only 98 participants per arm contributed observed Cycle 4 troughs; EMA reports evaluability of 46.7–47.6%. A hybrid assessment combining observations and predictions included SC 157 and IV 134, GMR 1.417 with 90% CI 1.294–1.551; SC 59 and IV 36 values were model-supplemented (2, Table 11). The table and figure above use observed-only assessments.
Trial PK noninferiority used a specified GMR's 90% CI lower bound of at least 0.80 (1, 2). This is neither an individual's concentration threshold nor this model's pass criterion. EMA also describes different primary trough time points in EU and non-EU assessments. A conditional ratio above 1 does not reproduce that trial inference.
Covariate sensitivity
I paired both routes across 20 combinations of weight 50, 60, 79, 80 or 100 kg and BMI 20, 24, 30 or 35, holding age, sex and ALB fixed. This grid examines equations, not a sampled patient population.
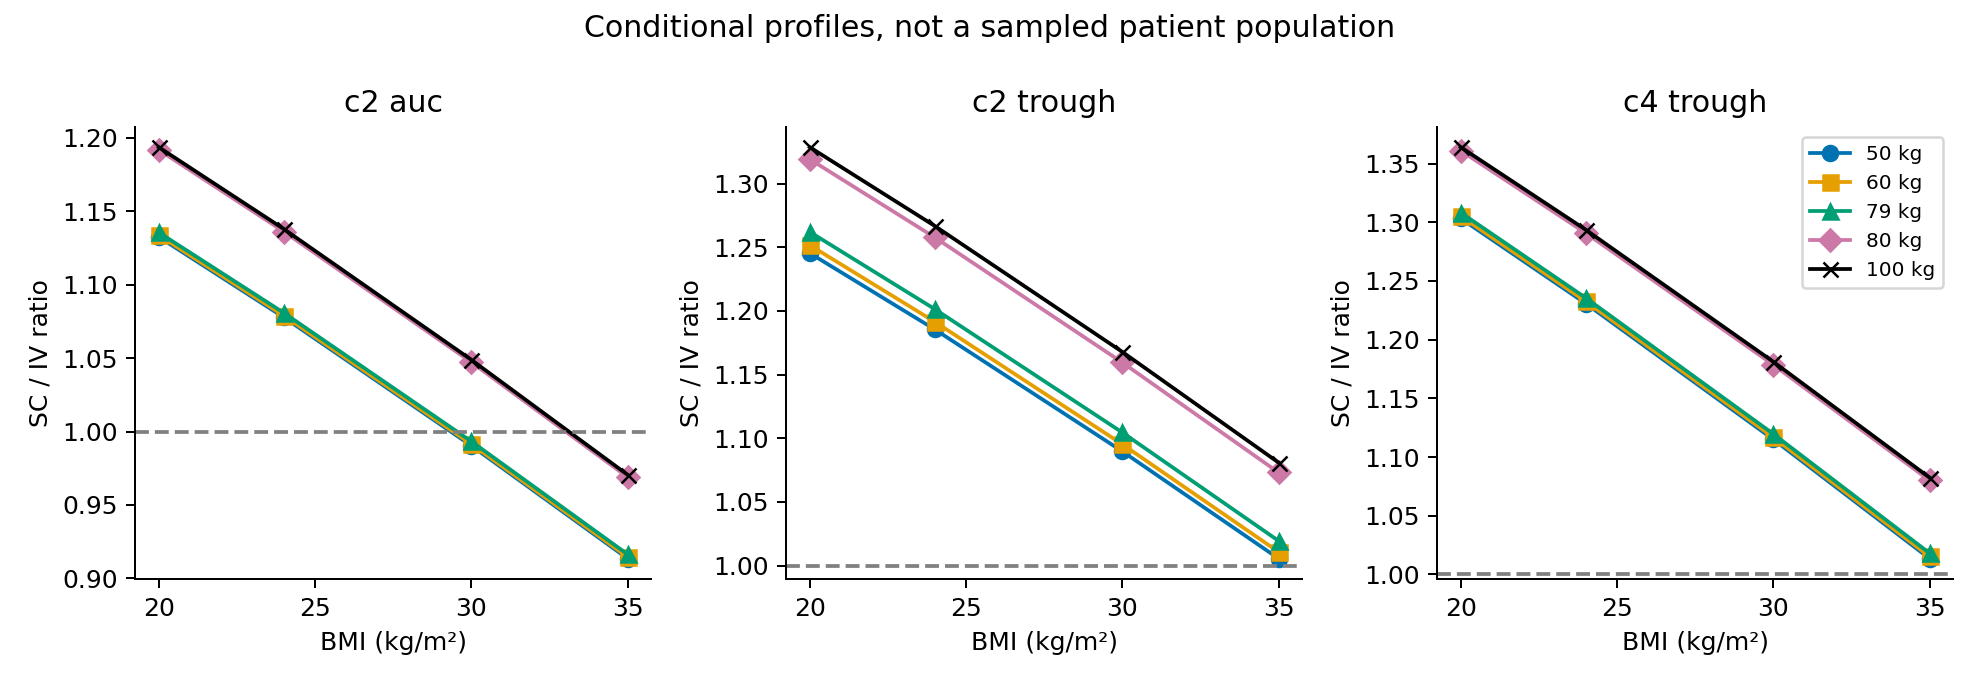
Figure 3. Conditional weight–BMI grid, not a population distribution.
At 60 kg and BMI 35, ratios were 0.915 for Cycle 2 AUC, 1.011 for Cycle 2 trough and 1.015 for Cycle 4 trough. Endpoints need not move equally. This does not support BMI-based dose changes; EMA did not regard BMI and age effects on absorption as clinically important (2). Actual weight and BMI are dependent and imply differing heights. Estimating population underexposure requires their joint distribution and IIV.
Numerical accuracy and model uncertainty
Nine structural parameters were varied individually to estimate ±1.96×SE using published RSE, with all others fixed. Covariate-coefficient uncertainty was excluded. This is not a joint parameter confidence region or a 95% prediction interval.
Table 6. One-at-a-time fixed-effect sensitivity.
| Endpoint | Reference ratio | Range across individual parameter changes |
|---|---|---|
| Cycle 2 AUC | 1.079 | 1.041–1.117 |
| Cycle 2 trough | 1.191 | 1.149–1.234 |
| Cycle 4 trough | 1.233 | 1.182–1.283 |
Tighter integration tolerances changed primary endpoints by at most 1.2×10⁻⁹ relatively. Mass-balance relative discrepancies were at most 6.3×10⁻¹⁶, comparing systemic input with depot/distribution amounts plus cumulative elimination. These check implementation, not fit to patients; outputs are in outputs/verification.json.
A structural control omitting Cycle 1 Days 8, 15 and 22 in both routes, retaining initial IV Day-2 splitting and subsequent Q2W dosing from Cycle 2 Day 1, gave Cycle 2 AUC ratio 0.927 and trough ratio 1.333. It illustrates dosing-history dependence, not a clinically recommended schedule.
Narrow fixed-effect sensitivity cannot compensate for missing joint covariates, IIV or actual histories. Infusion-duration, linear-only elimination and omitted-loading controls are in outputs/tables/sensitivity.csv; they examine structure and history, not alternative-treatment benefit or safety.
Discussion
AUC matching and trough matching are different comparisons. At Cycle 4, the reference-individual ratio differed substantially from the population GMR despite matching the nominal time point. Estimand and population differences remain.
Similar representative values do not establish individual-profile reproduction. Public summaries support comparisons of particular endpoints and times, not equivalence of every aspect of administration.
Data and code availability
Figures, tables and code derive from this article's calculations. Original figure/table images and individual patient data are not redistributed.
Download code, numerical tables and reproduction instructions.
References
- Leighl NB, Akamatsu H, Lim SM, Cheng Y, Minchom AR, Marmarelis ME, et al. Subcutaneous Versus Intravenous Amivantamab, Both in Combination With Lazertinib, in Refractory Epidermal Growth Factor Receptor–Mutated Non–Small Cell Lung Cancer: Primary Results From the Phase III PALOMA-3 Study. Journal of Clinical Oncology. 2024;42(30):3593–3605. doi:10.1200/JCO.24.01001.
- European Medicines Agency. Rybrevant assessment report. EMA/61503/2025; EMEA/H/C/005454/X/0014. 2025 Jan 30. Assessment report.
- Janssen-Cilag Ltd. Rybrevant 350 mg concentrate for solution for infusion: Summary of Product Characteristics. Product information. Accessed 2026 Oct 14.
- Subcutaneous Delivery of Amivantamab in Patients With Advanced Solid Malignancies: The Phase Ib PALOMA Study. 2026. PMID: 41807198. PubMed record.