How many Phase II readouts would it take to judge 'AI drugs still succeed 40% of the time'?
Exact binomial calculations show the uncertainty in small AI-drug phase 2 samples and the sample sizes needed for superiority or equivalence claims.
On this page
Sources were checked on 14 October 2026. This article uses elementary binomial calculations with publicly reported aggregate inputs, distinguishing published findings, calculations and interpretation.
An October 5 X post by @parmita discussed whether AI improves drugs, arguing that phase 2 success was approximately 40% both before and after AI. A 2024 analysis of clinical outcomes for AI-discovered molecules reports a phase 2 success rate of about 40%, while emphasizing the small sample (1). Both “AI has improved success” and “AI has not improved success” face the same question: can available data distinguish the difference?
Reported rates and their units
Jayatunga and colleagues survey pipelines of AI-centered biotechnology companies, reporting phase 1 success of 80–90% and phase 2 success of approximately 40% (1). The original phase 2 numerator and denominator could not be confirmed from the full text available for this article. Therefore, four successes in ten outcomes is used below only as an illustrative small sample with a 40% rate.
Later outcomes complicate “success.” Recursion announced discontinuation of REC-994 for cerebral cavernous malformation and REC-2282 for neurofibromatosis type 2 in May 2025, as reported by GEN (2). REC-994 met its phase 2 primary safety endpoint but was discontinued after longer-term data. The REC-2282 low-dose group passed a futility criterion while other groups did not. Insilico’s rentosertib progressed through phase 2a and began phase 3 in September 2026; a related article examines phase 2a. Whether each counts as a success depends on the endpoint and definition.
For a reference, the BIO, Informa and QLS Advisors report covering 2011–2020 gives a phase 2-to-3 transition rate of 28.9% across 4,933 transitions and phase 1 success of 52.0% across 4,414 (3). It provides a large sample and an explicit definition: advancement divided by advancement plus discontinuation.
The units remain mismatched. BIO counts phase transitions for molecule–indication combinations; the AI analysis counts molecules. BIO phase 2 rates also range from 15.0% in urology to 48.1% in hematology, with oncology at 24.6% (3). Disease mix changes the appropriate benchmark. The roughly 40% historical comparator discussed by Jayatunga and colleagues reflects another period or definition. Counting primary-endpoint achievement but ignoring subsequent discontinuation can inflate apparent success.
What ten outcomes establish
For four successes in ten outcomes, the exact Clopper–Pearson 95% confidence interval is 12.2–73.8%. An exact binomial test against 28.9% gives p=0.49.
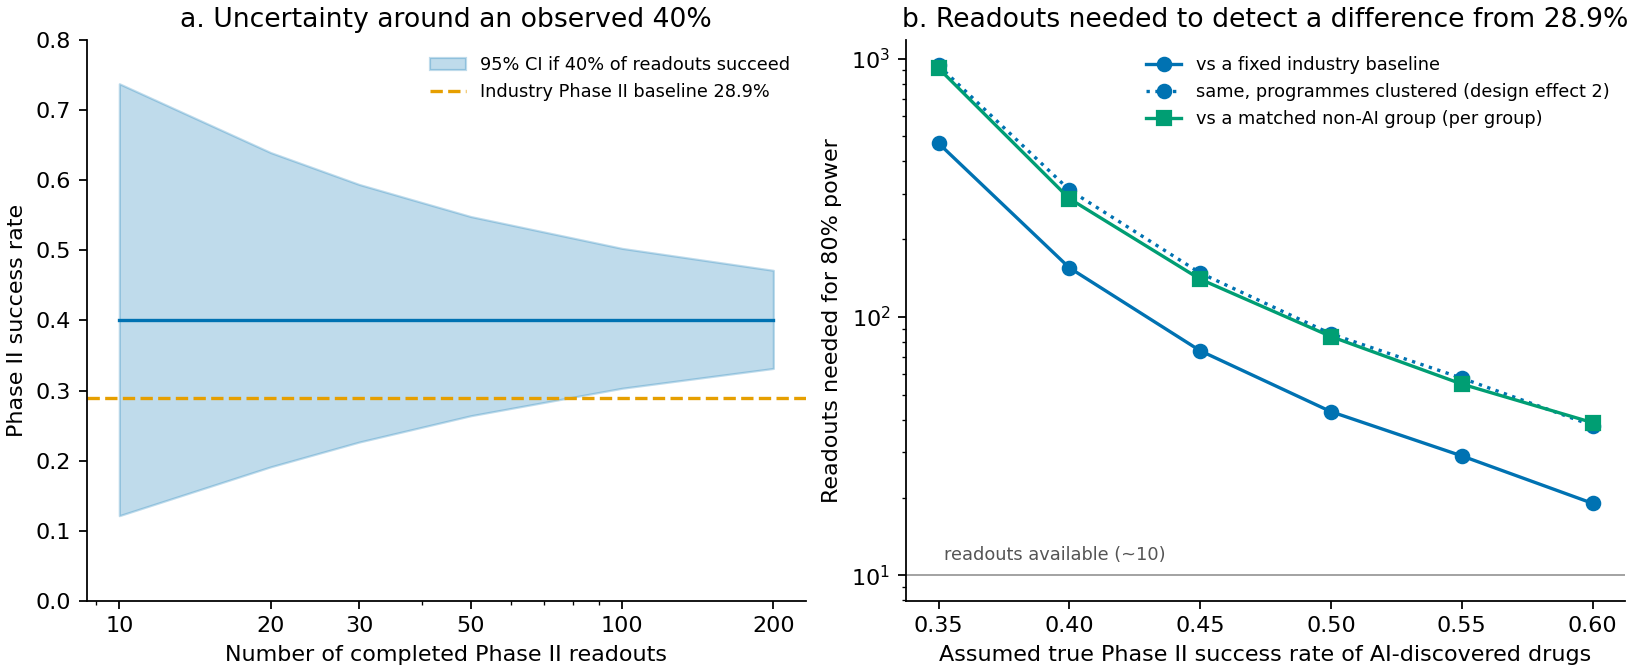
Figure 1. (a) Clopper–Pearson 95% intervals around an observed 40% success rate by number of phase 2 outcomes; the dashed reference is 28.9%. (b) Outcomes required for 80% power at two-sided α=0.05 under assumed true AI success rates. Solid blue uses exact binomial tests with a fixed known reference. Dotted blue doubles the sample requirement to illustrate clustering. Green uses equal-sized AI and non-AI groups with a normal approximation. The vertical axis is logarithmic and the horizontal line indicates approximately ten outcomes. The doubling is illustrative, not empirically estimated.
The interval extends below the reference and above 70%. Neither “40% means no improvement” nor “40% exceeds 28.9%, so improvement is established” follows. With ten outcomes, exact-binomial power is only about 38% if the true success rate is 50%, and about 63% if it is 60%. Outputs are results/summary.json and results/required_n.csv.
Sample sizes for detecting a difference
Holding the reference at 28.9%, I calculate exact-binomial sample requirements for 80% power. Discrete rejection thresholds make power fluctuate with sample size. “First reaching” reports the first crossing; “stable” requires that power also remain at least 80% for the following ten sample sizes. It does not guarantee monotonic power at every larger sample size.
Table 1. Required outcome counts under assumed true rates and comparison designs.
| True success rate | First reaching 80% | Minimum stable count | Illustrative clustering (2×) | Equal non-AI comparison (per group) |
|---|---|---|---|---|
| 35% | 446 | 470 | 940 | 917 |
| 40% | 136 | 155 | 310 | 287 |
| 45% | 67 | 74 | 148 | 140 |
| 50% | 41 | 43 | 86 | 84 |
| 60% | 19 | 19 | 38 | 39 |
An improvement of roughly ten percentage points requires hundreds of outcomes; even much larger improvements require dozens. Comparing with a fixed reference is optimistic because it ignores benchmark uncertainty and assumes comparable development problems.
Multiple molecules from the same company or target may share platforms, resources and decisions, reducing independent information. The clustering column simply doubles the required count because the strength of dependence is unknown; a 1.5× scenario is retained in the result files. Neither factor is estimated from observed clustering.
A contemporaneous, comparable non-AI group offers a fairer association comparison, though it does not automatically establish causality. An IQVIA commentary published in May 2026 compares programs with confirmed AI involvement against non-AI programs in similar company categories and sizes, reporting similar phase 2 success (4). The table uses equally sized groups. At a true AI rate of 40%, a non-AI comparison group five times larger requires approximately 168 AI outcomes; a group thirty times larger requires approximately 143.
Sample sizes for equivalence
Failure to detect a difference is not evidence of no meaningful difference. Equivalence requires a prespecified acceptable margin and sufficient precision within it. If the true rate is 28.9%, demonstrating equivalence within ±10 percentage points with 80% power requires approximately 180 outcomes, or 176 by the normal approximation used here. A wider margin reduces the requirement but weakens the meaning of equivalence.
Bias beyond sample size
Definitions of “AI-discovered” vary across target discovery, molecule design and optimization of existing candidates. Programs completing phase 2 early may favor established targets or indications with easily measured effects; early failures may also be reported sooner. The net direction of this timing bias cannot be assumed.
Primary-endpoint achievement differs from advancement, as REC-994 illustrates. Public-information denominators can also be incomplete if successes are announced more visibly than discontinuations. Larger samples alone do not remove these comparison biases.
Different denominators remain consequential
Observed rate differences combine small-sample uncertainty with differences in what counts as one outcome. Treating related programs as independent overstates information. The reported success rate of approximately 40% is therefore not itself an estimate of AI’s causal contribution. Without comparable populations, development stages and outcome definitions, aggregate rates cannot isolate that contribution.
Data and code availability
The calculation script generates results/ and Figure 1 from the stated inputs in approximately two minutes. Tested NumPy, SciPy and Matplotlib versions are fixed in requirements.txt.
python -m pip install -r requirements.txt
python phase2_numbers.py
The four-of-ten example is not a verified numerator and denominator from Jayatunga and colleagues. The 28.9% reference spans all diseases in 2011–2020 and uses a different counting unit. Uniform 1.5× and 2× clustering factors are illustrations. Non-AI comparison and equivalence calculations use normal approximations. These conditions limit interpretation of every reported sample requirement.
References
1. Jayatunga MKP, Ayers M, Bruens L, Jayanth D, Meier C. How successful are AI-discovered drugs in clinical trials? A first analysis and emerging lessons. Drug Discovery Today. 2024;29(6):104009. doi:10.1016/j.drudis.2024.104009.
2. Genetic Engineering & Biotechnology News. Recursion halts four pipeline programs, sharpening cancer, rare disease focus. 2025 May 5. Article. Secondary reporting on the first-quarter 2025 announcement.
3. BIO, Informa Pharma Intelligence, QLS Advisors. Clinical development success rates and contributing factors 2011–2020. 2021. Report.
4. IQVIA. IQVIA Institute’s Global R&D Trends 2026 report finds credible signal on AI-enabled programs. 2026 May. Article.