AI aptamer discovery: what were the molecules binding to?
An audit of Google’s aptamer report checks hit-rate denominators, bead correction and unresolved threshold inconsistencies.
On this page
The search was supposed to find DNA binding to myoglobin. After one experimental cycle, the hit rate fell from 10.2% to 3.7%, even though uncorrected enrichment appeared to improve. What had the experiment selected?
This failure appears in Google Research's October 16, 2026 account of agent-guided aptamer discovery (1). Agents designed candidates, read experimental results and proposed the next round. According to the report, the expanding group included candidates binding other proteins and assay beads as well as the intended target.
The interesting point is how separating binding measures reverses the apparent direction of progress. There are also unresolved differences between the report's main-text and supplementary explanations of what counts as a hit.
I checked published aggregate values to distinguish supported improvements from claims that remain unverified. The study is an interesting example of design revised using feedback that includes controls. Higher hit rates do not by themselves establish AI superiority or a finished drug.
Sources checked on October 19, 2026. The primary source is Cutts and colleagues' October 12 research report (2), not a peer-reviewed paper. The calculations below are not raw sequence–activity reanalysis.
Binding to beads as well as target
Aptamers bind molecules through properties including folded nucleic-acid structures. Here, synthesized single-stranded DNA candidates were incubated with protein-bearing magnetic beads. Recovered candidates were amplified and sequenced to measure enrichment relative to the input library.
Recovery from protein-bearing beads alone does not establish target binding: a candidate adhering to the bead surface can also be recovered.
The study measured target-bearing beads, bare beads and alternative-protein controls. Main targets were myoglobin and α-thrombin; HER2 was added as a counter-target later. Changing the protein and changing the surface interrogate different failure modes (Methods, pp. 15–17).
Round-2 myoglobin designs shifted toward G-quadruplex, or G4, structures, which guanine-rich sequences can form. G4 is not inherently undesirable; useful structures differ by target. The authors interpret the increased G4 group in the myoglobin campaign as containing many counter-target binders.
The next round changed structural-family allocation and considered bead background. The reported myoglobin hit rate rose to 33.5% in Round 3 (Results R.3, pp. 4–6).
The denominator behind 33.5%
Supplementary Table S3 separates new target-directed designs, other-target designs, carried-over candidates and controls. The prominent hit rate is not a success fraction for the entire pool.
Table 1. Reported hit rates among newly designed target-directed candidates.
| Target | Round 1 | Round 2 | Round 3 |
|---|---|---|---|
| Myoglobin | 20/196 = 10.2% | 9/244 = 3.7% | 184/549 = 33.5% |
| α-Thrombin | 0/167 = 0% | 54/208 = 26.0% | 131/311 = 42.1% |
These are recalculations of headline counts with new target-directed candidates as denominators. Round-1 myoglobin has a threshold-label caveat discussed below (Supplementary Table S3, pp. 25–26).
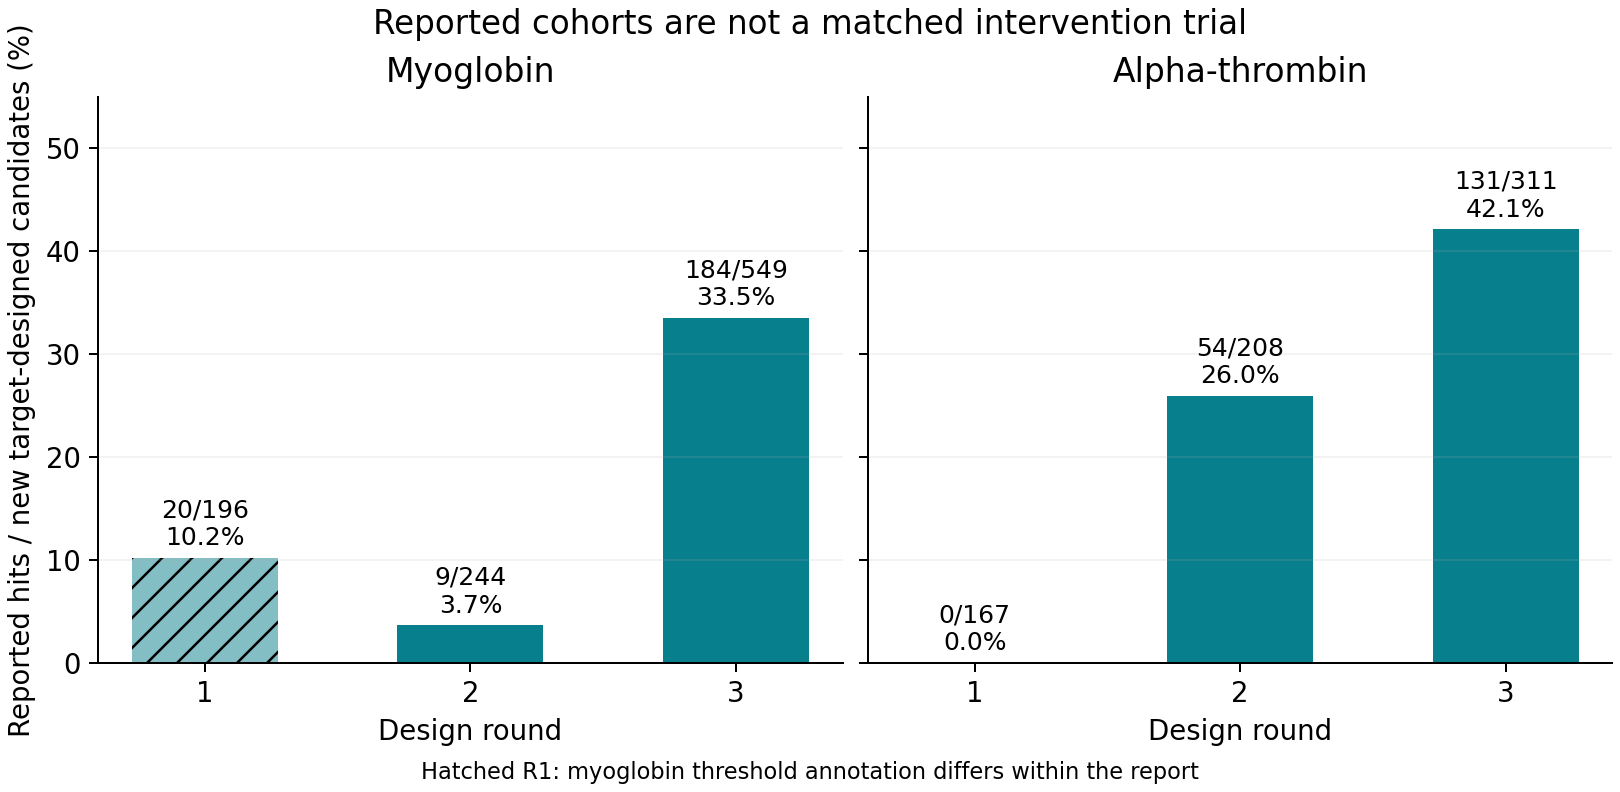
Figure 1. Author's redrawing of reported aggregate hit rates, not an independent replication.
From myoglobin Round 2 to Round 3, hit rate increased about 9.1-fold, but hit count increased about 20.4-fold, from nine to 184. Candidate count also rose 2.25-fold, from 244 to 549. The comparison does not hold search effort fixed.
A newly synthesized candidate is not necessarily free of known motifs. Excluding known-motif descendants gives α-thrombin Round 3 as 106/286 =37.1%, distinct from 42.1% for all new candidates. Table S3 also gives a strict de novo myoglobin subset of 184/547 =33.6%. I retain the main-table denominator of 549 rather than switching it mid-comparison.
Reported “specificity” uses another denominator: among statistically detected binders in a benchmark with counter-target measurements, the fraction binding only the intended target. Myoglobin values are 75.0% →19.1% →72.4%, but these do not describe the same population as 20/196. Multiplying the two quantities would not establish a probability of obtaining a usable candidate.
Improvement survives threshold changes but its magnitude varies
The Methods reports myoglobin Round-2-to-3 counts under looser and stricter criteria.
Table 2. Hit rates recalculated from the report's alternative-threshold counts.
| Criterion | Round 2 | Round 3 | Difference | Ratio |
|---|---|---|---|---|
| Lenient | 16/244 = 6.6% | 211/549 = 38.4% | +31.9 percentage points | 5.9-fold |
| Headline | 9/244 = 3.7% | 184/549 = 33.5% | +29.8 percentage points | 9.1-fold |
| Strict | 6/244 = 2.5% | 85/549 = 15.5% | +13.0 percentage points | 6.3-fold |
Calculations use original integer counts. The lenient criterion is described as FDR <0.05, log2 fold change >0.5 and bead-corrected residual >0.5. The strict criterion uses FDR <0.01, log2 fold change ≥1.5 and residual >1.5 (Methods, p. 17).
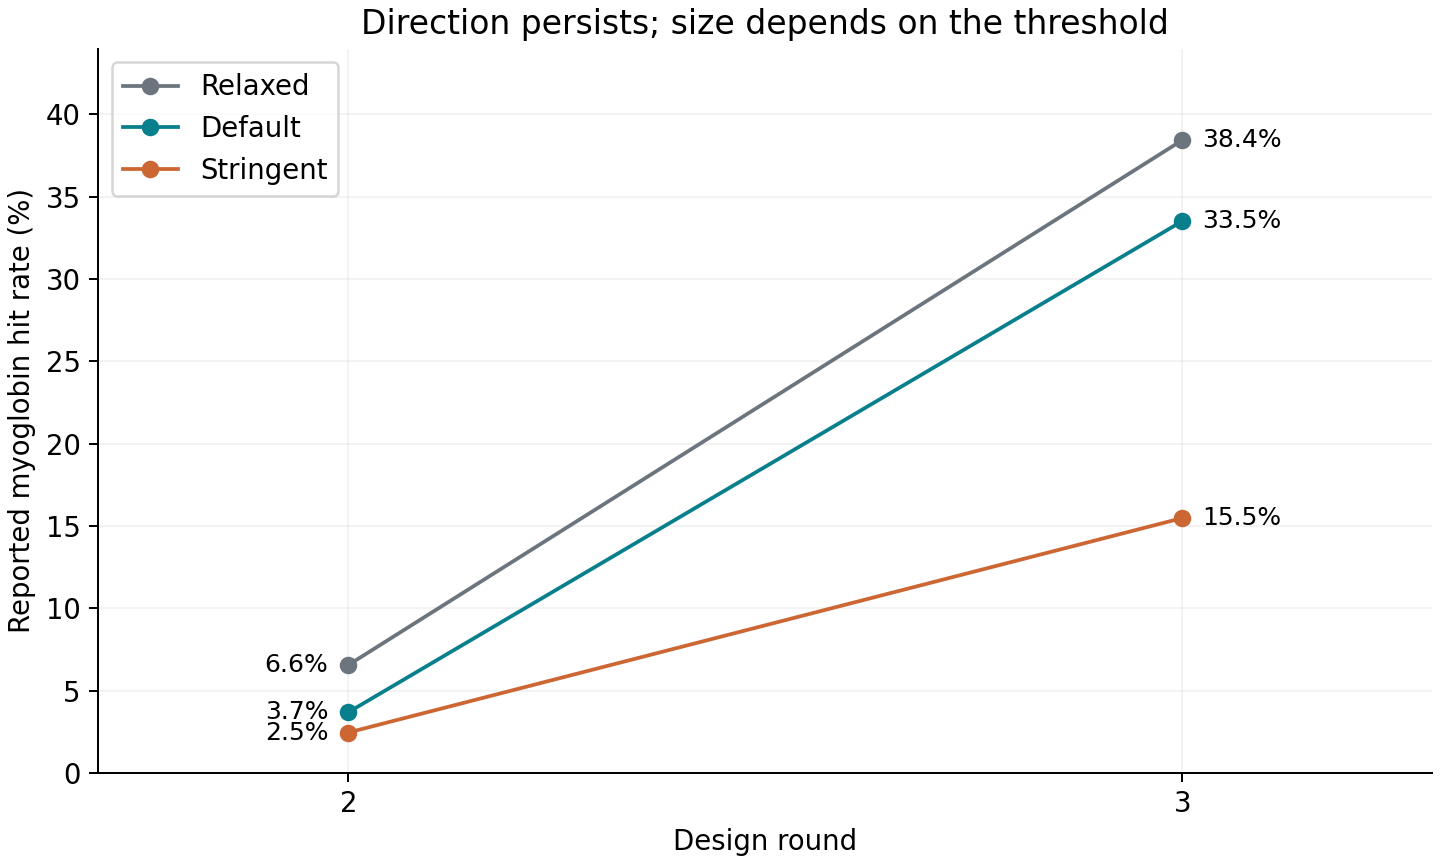
Figure 2. Author's redrawing of aggregate threshold sensitivity. All criteria show improvement, but fold changes differ.
Within these summaries, the direction is consistent. The ninefold magnitude depends on the criterion: the strict definition gains about 13 percentage points, the lenient one about 32. A headline stating only the largest fold change loses that range.
I checked the authors' alternative-threshold aggregates rather than applying thresholds to raw data. Related designs and common ancestry make independent-trial assumptions questionable, so I added neither binomial confidence intervals nor new significance tests.
Can correction increase the number of hits?
Bead correction is not necessarily subtraction. The report regresses enrichment on target-bearing beads against enrichment on bare beads and examines residuals above the predicted background. Immobilized protein can itself change access to the bead surface.
An increased count after correction is not automatically an error. The concern is the separately stated threshold on raw target enrichment.
Methods describes FDR <0.05, target-versus-input enrichment and bead-corrected residual >1. Table S3's Round-3 myoglobin row also states log2 fold change ≥1, alongside the following counts.
Table 3. Reported raw enrichment and on-target hits in the same candidate population.
| New Round-3 myoglobin candidates | Count |
|---|---|
| Raw enriched, log2 fold change ≥1 | 164/549 |
| On-target hit including statistical and bead-correction criteria | 184/549 |
If the original ≥1 requirement remains in force for the same 549 candidates, adding requirements must yield a subset. Instead, 20 more candidates appear. The analogous α-thrombin counts, 251/311 →131/311, satisfy that necessary ordering, though a smaller count alone does not validate its full aggregation.
An alternative reading distinguishes the Methods' positive-raw-enrichment condition from the parenthetical ≥1 threshold for “volcano pre-hits”. Under different-stage rules, a corrected count can increase: regression residuals can admit candidates whose raw values were below one.
For illustration, the stated Round-3 myoglobin background prediction is −0.454 +0.430 ×bead enrichment. If target log2 fold change were 0.8 and bead enrichment zero, the residual would be 0.8 −(−0.454) =1.254. With the FDR condition also satisfied, positive raw enrichment and residual >1 would admit it despite a raw value below one. This is an illustrative candidate, not an observed measurement.
Thus, the ordering 164 versus 184 does not alone prove an error. Reproduction requires identifying which rule actually generated the counts. The relation between Table S3/Supplementary Figure S1's ≥1 language and the separate-stage reading of Methods remains unresolved. I do not arbitrarily remove the extra 20 candidates to invent a corrected hit rate (Methods and Supplementary Figure S1, pp. 17 and 21).
Round 1 has a similar caveat: the headline myoglobin count is 20/196, while Table S3 also reports 18 satisfying log2 fold change ≥1. That gives 18/196 =9.2%. Its relationship to Methods' statement of consistent criteria across rounds is unresolved. Accordingly, 10.2% →3.7% →33.5% is not treated as a fully harmonized time series.
The report states that complete sequence–activity and differential-enrichment tables will accompany peer-reviewed publication. The checked materials do not yet permit obtaining those tables and reproducing identical classifications (Data availability, p. 18).
Learning from experiments versus an AI effect
The controls remain instructive despite these caveats. Measuring input libraries, bare beads and other targets helps explain why recovery increased. Informative observations can reveal movement in the wrong direction instead of merely maximizing a weak metric faster.
Three rounds do not establish that AI reasoning outperforms ordinary optimization. Agent architecture changed between the first and later rounds; candidate counts and family allocations also changed. Methods says human researchers performed wet-lab operations, amplification and sequencing. This is not a demonstration of end-to-end autonomous robotic execution of the aptamer campaign.
The authors identify equal-budget controls without feedback, without reasoning and with Bayesian optimization as future comparisons. I likewise do not attribute all improvement to reasoning alone (Discussion, p. 12).
Affinity is another validation question. Single-clone concentration-series experiments covered eight α-thrombin candidates, not all 184 myoglobin hits. Some known-motif descendants had reported nanomolar apparent dissociation constants. De novo T05 and T06 began showing binding at 1 µM; T07 and T08 remained undetected at that assay limit. Because saturation was not reached within the measured range, the report treats estimates as preliminary. Hit rate, affinity, function and drug usefulness require separate evidence.
Controls change the meaning of selection
Target-only enrichment and enrichment accounting for other proteins or beads count different candidates as successes. The aggregate audit establishes how this definitional difference affects hit-rate interpretation.
It does not isolate which control feedback improved agent design. Final-round performance includes changed candidate populations. Without tracing candidate identities and design histories across the feedback step, hit-rate change cannot be attributed solely to AI learning.
Data and code availability
Input tables, code and instructions recalculate rates and ratios from published counts and check alternative thresholds and the necessary subset-count condition. Run analysis.py, python -m unittest test_analysis.py and plot.py in that order. Original PDF, sequences and agent logs are not redistributed.
The original work in this article is arithmetic and consistency checking of public summaries, not raw-data reanalysis or experimental replication.
References
- Rao P, Sirkovic P, Pawlosky A. Grounding AI agents in biological reality: building blocks for autonomous wet labs. Google Research Blog. 2026 Oct 16. Research blog.
- Cutts Z, Coller J, Chen R, Tang H, Bellaiche M, Easterlin R, et al. Aptamers as a sandbox for lab-in-the-loop agentic molecular discovery. Google Research [research report; not peer reviewed]. 2026 Oct 12. Report PDF.